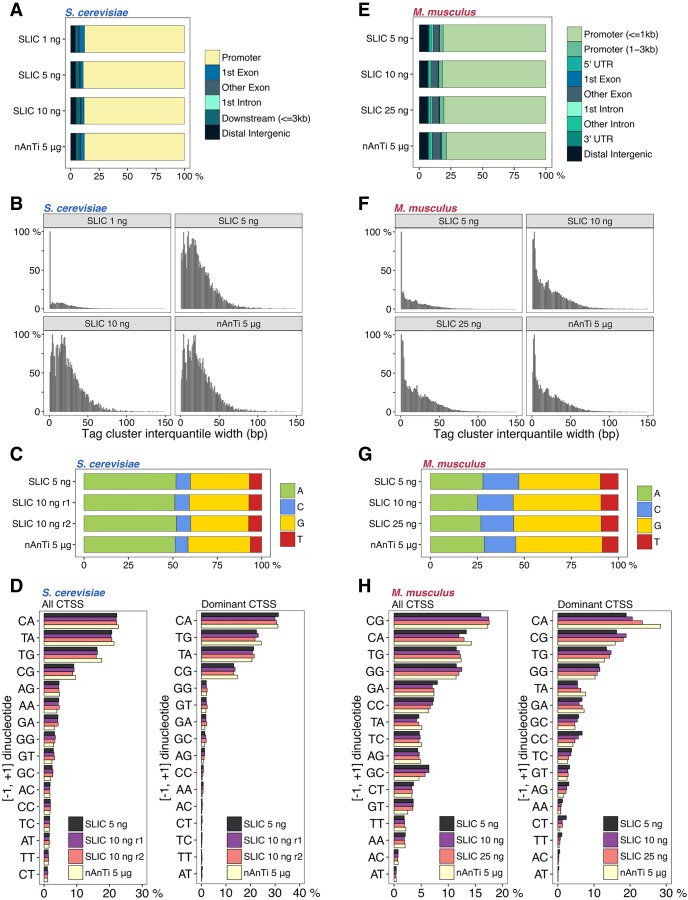
Figure 2.
Identifying the lower limits of SLIC-CAGE libraries. (A) Genomic locations of tag clusters identified in SLIC-CAGE libraries prepared from 1, 5, or 10 ng of S. cerevisiae total RNA versus the reference nAnT-iCAGE library. (B) Distribution of tag cluster inter-quantile widths in SLIC-CAGE libraries prepared from 1, 5, or 10 ng of S. cerevisiae total RNA and in the nAnT-iCAGE library. (C) Nucleotide composition of all CTSSs identified in SLIC-CAGE libraries prepared from 5 or 10 ng of S. cerevisiae total RNA and in the reference nAnT-iCAGE library. (D) Dinucleotide composition of all CTSSs (left panel) or dominant CTSSs (right panel) identified in SLIC-CAGE libraries prepared from 5 or 10 ng of S. cerevisiae total RNA and in the nAnT-iCAGE library. Both panels are ordered from the most to the least used dinucleotide in nAnT-iCAGE. (E) Genomic locations of tag clusters in SLIC-CAGE libraries prepared from 5, 10, or 25 ng of M. musculus total RNA and in the nAnT-iCAGE library. (F) Distribution of tag cluster inter-quantile widths in SLIC-CAGE libraries prepared from 5, 10, or 25 ng of M. musculus total RNA and the nAnT-iCAGE library. (G) Nucleotide composition of all CTSSs identified in SLIC-CAGE libraries prepared from 5, 10, or 25 ng of M. musculus total RNA or identified in the nAnT-iCAGE library. (H) Dinucleotide composition of all CTSSs (left panel) or dominant CTSSs (right panel) identified in SLIC-CAGE libraries prepared from 5, 10, or 25 ng of M. musculus total RNA or identified in the reference nAnT-iCAGE library. Both panels are ordered from the most to the least used dinucleotide in the reference nAnT-iCAGE.

