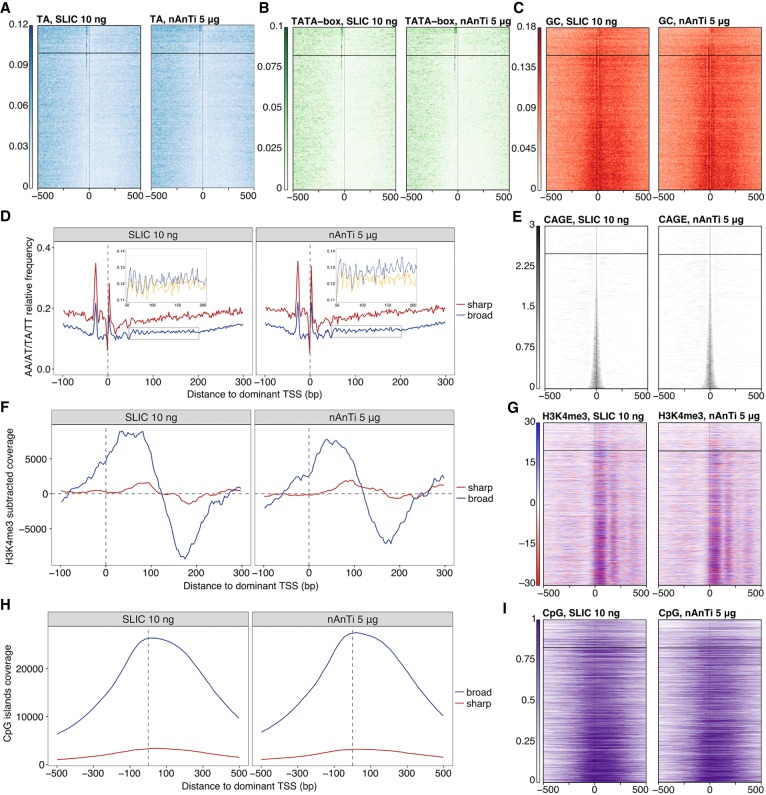
Figure 4.
SLIC-CAGE is equivalent to nAnT-iCAGE for pattern discovery. Comparison of SLIC-CAGE derived from 10 ng and nAnT-iCAGE derived from 5 µg of M. musculus total RNA. In all heat maps, promoters are centered at the dominant CTSS (dashed vertical line at 0) and ordered by tag cluster inter-quantile width with sharpest promoters on top and broadest on the bottom of each heat map. The horizontal line separates sharp and broad promoters (empirical boundary for sharp promoters is set at inter-quantile width ≤ 3). (A) Comparison of TA dinucleotide density in the SLIC-CAGE (left) and nAnT-iCAGE library (right). As expected, sharp promoters have a strong TA enrichment, in line with the expected TATA-box in sharp promoters around the −30 position. (B) Comparison of TATA-box density in SLIC-CAGE (left; 14.3% of TCs have a TATA-box around −30 position) vs. nAnT-iCAGE library (right; 14.5% of TCs have a TATA-box around −30 position). Promoter regions are scanned using a minimum of the 80th percentile match to the TATA-box position weight matrix (PWM). Sharp promoters exhibit a strong TATA-box signal as suggested in A. (C) Comparison of GC dinucleotide density in the SLIC-CAGE (left) and nAnT-iCAGE library (right). Broad promoters show a higher enrichment of GC dinucleotides across promoters, suggesting the presence of CpG islands, as expected in broad promoters. (D) Average WW (AA/AT/TA/TT) dinucleotide frequency in sharp and broad promoters identified in SLIC-CAGE (left) or nAnT-iCAGE library (right). Inset shows a closer view on WW dinucleotide frequency (blue) overlain with the signal obtained when the sequences are aligned to a randomly chosen identified CTSS within broad promoters (yellow). Ten-base-pair WW periodicity implies the presence of well-positioned +1 nucleosomes in broad promoters, in line with the current knowledge on broad promoters. (E) Tag cluster coverage heat map of SLIC-CAGE (left) or nAnT-iCAGE library (right). (F) H3K4me3 relative coverage in sharp versus broad promoters identified in SLIC-CAGE (left) or nAnT-iCAGE (right). Signal enrichment in broad promoters indicates well-positioned +1 nucleosomes, in line with the presence of WW periodicity in broad promoters. (G) H3K4me3 signal density across promoter regions centered on SLIC-CAGE or nAnT-iCAGE-identified dominant CTSS. (H) Relative coverage of CpG islands across sharp and broad promoters, centered on the dominant CTSS identified in SLIC-CAGE (left) or nAnT-iCAGE (right). These results agree with GC-dinucleotide density signal, which is much stronger in broad promoters. (I) CpG islands coverage signal across promoter regions centered on the dominant CTSS identified in SLIC-CAGE (left; 68.1% of TCs overlap with a CpG island) or nAnT-iCAGE (right; 64.4% of TCs overlap with a CpG island).

