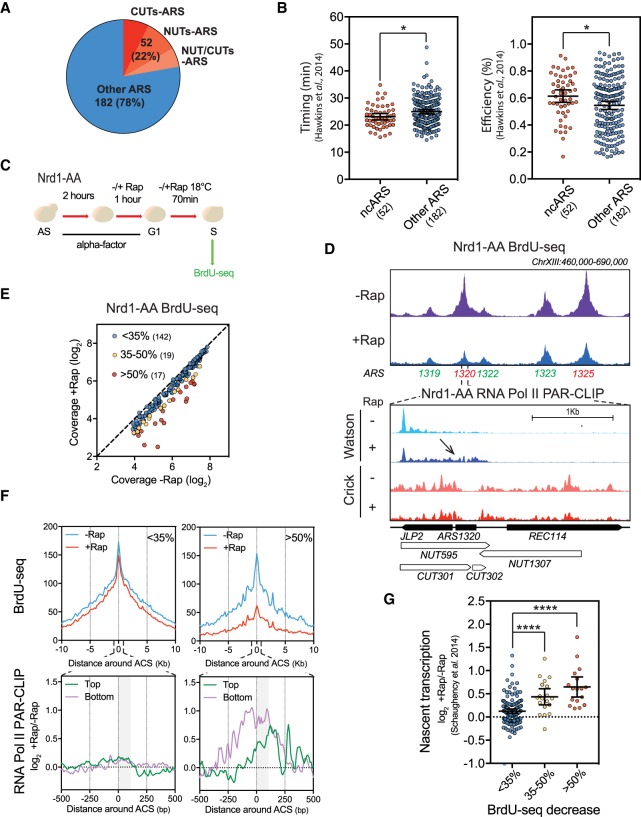
Figure 1.
NUTs- and CUTs-containing ARSs are down-regulated when early termination of noncoding RNAs is abrogated. (A) Numbers and proportions of ARSs overlapping with CUTs only (red), NUTs only (orange), or both CUTs and NUTs (pink). ARS annotations used in this study are listed in Supplemental Table S1. CUTs and NUTs were considered as overlapping when showing 50 bp of overlap in the ACS to +100 bp area according to the ACS T-rich sequence. (B) Scatter dot-plot indicating the timing and efficiency of the noncoding RNA-containing ARSs (ncARSs) compared to replication origins devoid of overlapping CUTs and NUTs (Other ARSs). Timing and efficiency data were retrieved from Hawkins et al. (2013). The mean and the 95% confidence interval are indicated. (C) Nrd1-AA cells were synchronized in G1-phase with alpha-factor for 3 h at 30°C. During the last hour, rapamycin (Rap) was added or not in the medium. Cells were then washed and released into the cell cycle at 18°C in the presence of BrdU and −/+Rap. After 70 min, cells were collected for DNA extraction and BrdU-seq. (D) Snapshot depicting a part of Chromosome XIII for the BrdU-seq. Affected ARSs are indicated in red and nonaffected in green. Bottom panel shows a zoom around ARS1320 of the RNA Pol II PAR-CLIP in the Nrd1-AA strain (Schaughency et al. 2014). Transcriptional readthrough is indicated by an arrow. (E) Plot depicting the mean coverage of BrdU nascent DNA in a 5-kb window around ACS in −Rap versus +Rap. The 17 red dots and 19 yellow dots represent the ARSs showing at least 50% and 35%–50% decrease in BrdU incorporation in +Rap, respectively. Blue dots represent the ARSs defined as nonaffected in BrdU incorporation. (F) Top: Metagene analysis of the BrdU-seq for the 142 nonaffected ARSs (<35%) and the 17 most affected ARSs (>50%). Profiles represent the mean coverage smoothed by a 200-bp moving window. ARSs were oriented according to their ACS T-rich sequence. Bottom: Metagene profiles of the ratio log2 +Rap/−Rap of the RNA Pol II PAR-CLIP signal 500 bp around the oriented ACS of the least and most affected ARS (Schaughency et al. 2014). Plots were smoothed by a 10-bp moving window. Since ARSs are oriented, nascent transcription going toward replication origins is defined as Top and Bottom. The gray box represents the window in which transcriptional readthrough was analyzed in G. (G) Scatter dot-plots representing the ratio log2 +Rap/−Rap of the RNA Pol II PAR-CLIP signal over the three classes of ARSs defined in E. Total nascent transcription in +Rap and −Rap was defined on oriented ARSs by adding the RNA Pol II PAR-CLIP mean densities between the ACS to +100 bp on the top strand to the signal over the same region on the bottom strand in each condition using the data from Schaughency et al. (2014). Each 100-bp segment was considered as 1 bin (see Methods). (*) P-value < 0.05; (****) P-value < 0.0001.

