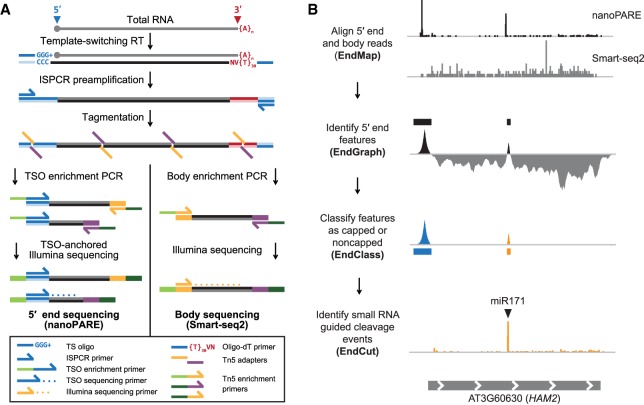
Figure 1.
Workflow of nanoPARE and EndGraph. (A) Diagram of the nanoPARE protocol, which enables construction of a stranded 5′ end library (left) in parallel with a nonstranded transcript body library (Smart-seq2, (Picelli et al. 2013) from the same RNA sample. All oligonucleotides are labeled in the legend below. (B) Workflow of the nanoPARE data analysis pipeline for identifying distinct capped and noncapped 5′ end features from a paired nanoPARE and Smart-seq2 sequencing library. Diagram represents the output of each step, using HAM2 as an example.

