Figure 2.
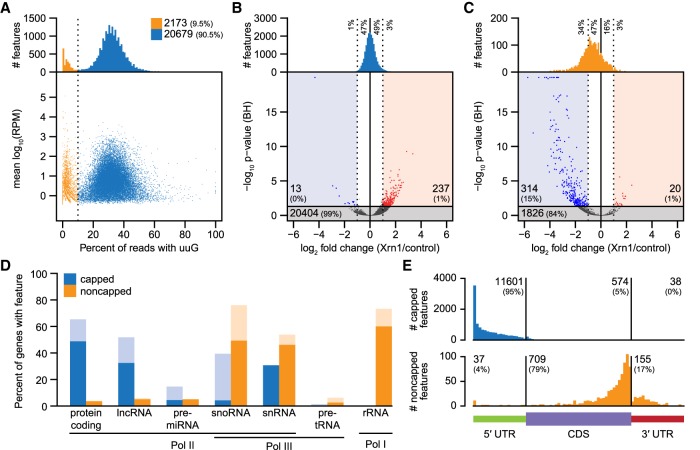
Identification of capped and noncapped 5′ end features with EndGraph. (A) RNA 5′ end features identified from 5 ng of floral bud total RNA, distributed by the proportion of nanoPARE reads containing an upstream untemplated guanosine (uuG). The vertical line separates putative noncapped features (low-uuG, orange) from putative capped features (high-uuG, blue). (B) Volcano plot of the change in read abundance for putative capped features after digestion with Xrn1 exonuclease. Bar plots depict the distribution of all capped features by fold change versus control. Dotted lines delimit a twofold change in feature abundance. Log2 fold change and Benjamini-Hochberg adjusted P-values (BH) were calculated by DESeq2. Horizontal line demarcates an adjusted P-value of 0.05. (C) Volcano plot as in B for putative noncapped features. (D) Capped and noncapped features overlapping TAIR10 genes classified by gene type. Lighter bars include features up to 500 nt upstream of the annotation. (E) Positional distribution of capped (top) and noncapped (bottom) features that overlap protein-coding genes.

