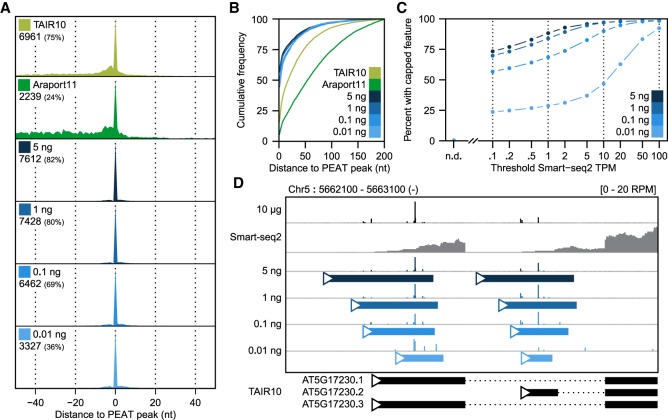
Figure 3.
Sensitive low-input transcription start site detection with nanoPARE. (A) Recall of capped peaks identified with PEAT (Morton et al. 2014) in two Arabidopsis reference annotations (TAIR10 and Araport11) and in nanoPARE features detected from a dilution series of total RNA input. Numbers indicate how many PEAT peaks have a 5′ end feature within 50 bp in the test data set. (B) Cumulative frequency distribution of positional error for all 5′ features within 200 nt of a PEAT peak. (C) Sensitivity of nanoPARE in detecting capped 5′ features for nuclear protein-coding genes as a function of their abundance measured by Smart-seq2. Points indicate the percent of transcripts above the given threshold abundance (in transcripts per million, TPM) that contain a capped feature identified in at least two of three biological replicates. (D) Integrated Genomics Viewer (IGV) browser image of nanoPARE reads from the dilution series mapping to two transcription start sites of the PSY locus. y-axis shows mean reads per million (RPM) across three biological replicates for each dilution. Solid colored bars mark capped features identified by EndGraph in each dilution.

