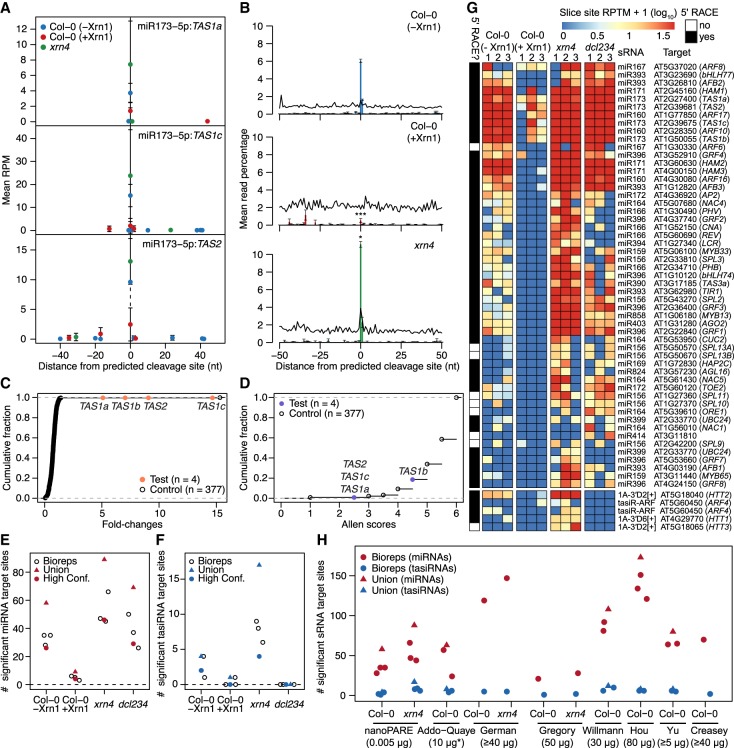
Figure 4.
Detection of sRNA-mediated cleavage sites. (A) Scatter plot illustrating the number of nanoPARE read 5′ ends per million transcriptome-mapping reads within 50 nt of predicted miR173-5p–directed cleavage sites in TAS1a (top), TAS1c (middle), and TAS2 (bottom) transcripts. Mean RPM values of three biological replicates are shown for libraries prepared from 5 ng of total RNA from wild-type (Col-0) floral buds either not incubated with Xrn1 (Col-0 [−Xrn1]) or incubated with Xrn1 (Col-0 [+Xrn1]), or xrn4-5 mutant floral buds (xrn4). Error bars represent standard errors of the means. (B) Number of nanoPARE read 5′ ends mapping within 50 nt of miRNA cleavage sites significantly detected by EndCut (Benjamini-Hochberg adjusted P-values < 0.05) in Col-0 (−Xrn1) libraries are shown as bar charts of the percentage of the total number of nanoPARE reads detected for each transcript in libraries prepared from Col-0 (−Xrn1) (top), Col-0 (+Xrn1) (middle), and xrn4 (bottom) samples. Percentages of all predicted miRNA cleavage sites are shown as line graphs. * and *** indicate that the mean number of reads at predicted cleavage sites are significantly different in Col-0 (−Xrn1) libraries compared to either Col-0 (+Xrn1) or xrn4 libraries (P-values <0.05 and 0.001, respectively; one-tailed K-S tests). (C,D) Cumulative fractions of fold changes (C) and Allen scores (D) are shown for target sites predicted for either miR173-5p (test) or its randomized cohorts (control). (E,F) One-dimensional scatter plots illustrating the number of significant miRNA (E) or tasiRNA (F) target sites (Benjamini-Hochberg adjusted P-values < 0.05) detected in libraries prepared from Col-0 (−Xrn1), Col-0 (+Xrn1), xrn4, or dcl234 samples. Values for individual biological replicates (bioreps), all detected sites (union), and significant interactions observed in at least 2/3 bioreps (High conf.) are shown. (G) Heat maps depicting the number of nanoPARE read 5′ ends per 10 million transcriptome-mapping reads (RPTM; log10) mapping to the high-confidence miRNA- (top) or tasiRNA- (bottom) directed cleavage sites denoted in panels E and F. Small RNA families and corresponding targets are indicated beside each row, and targets previously verified by 5′ RACE are annotated. (H) One-dimensional scatter plot showing the number of significant miRNA and tasiRNA target sites detected with EndGraph from nanoPARE libraries prepared from Col-0 or xrn4 floral bud total RNA (nanoPARE) or published degradome/PARE libraries prepared from Col-0 or xrn4 floral tissue total RNA. Published degradome/PARE libraries are indicated by the first author of the corresponding study: Addo-Quaye (Addo-Quaye et al. 2008), German (German et al. 2008), Gregory (Gregory et al. 2008), Willmann (Willmann et al. 2014), Hou (Hou et al. 2016), Yu (Yu et al. 2016), and Creasey (Creasey et al. 2014). The amounts of total input RNA (µg) used in each publication are indicated. The asterisk denotes that the Addo-Quaye samples were prepared from polyadenylated RNA instead of total RNA.

