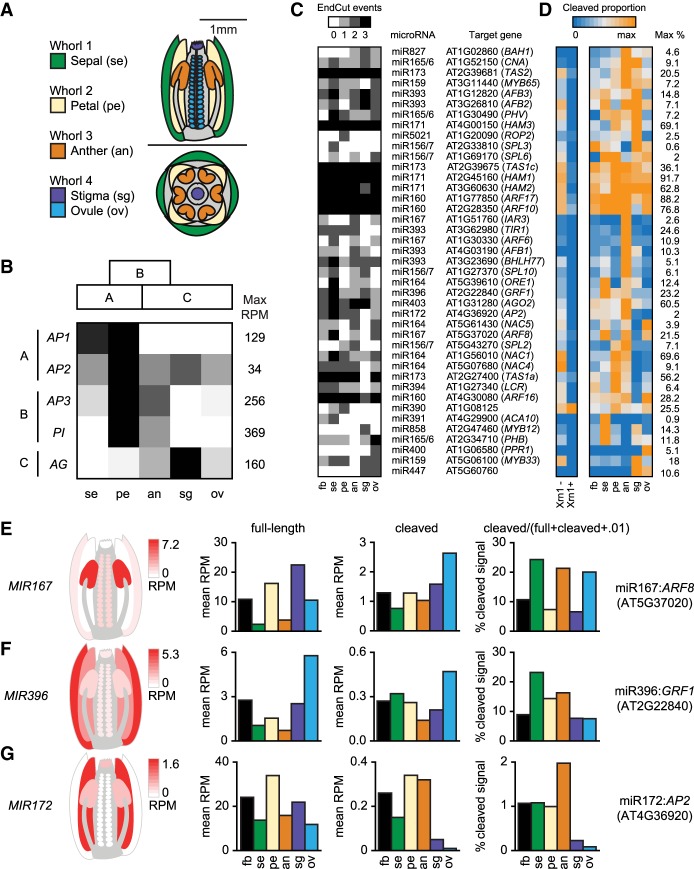
Figure 5.
Tissue-specific miRNA-target interactions with nanoPARE. (A) Diagrams of a longitudinal section (top) and cross-section (bottom) of an Arabidopsis flower at the onset of anthesis. Tissue types isolated for nanoPARE libraries are color-coded as shown. (B) Relative expression of the five ABC model homeotic genes across the five tissue types in panel A. Each row is scaled from zero to the maximum observed reads per million of a gene's capped feature. Expected spatial distributions based on the ABC model are shown as blocks above. (C,D) Heat maps of 41 high-confidence miRNA cleavage sites detected by nanoPARE in whole flowers (fb) and individual tissue types illustrating either the number of biological replicates in which the cleavage site was significantly detected (EndCut events) (C) or the proportion of cleaved signal to total full-length and cleaved signal (D). Each row is scaled to the maximum proportion observed for that interaction, which is indicated on the right. (E–G) (Left) Heat maps of the summed primary transcript levels for three families of miRNA genes in flowers as measured by nanoPARE. Floral tissues match those labeled in panel A. (Right) Bar charts depicting the relative abundance of full-length RNA, truncated RNA with a 5′ end matching the miRNA cleavage site, and the proportion of cleaved RNA to the total cleaved and full-length signal, for the most strongly cleaved target of each of the three miRNA families to the left.

