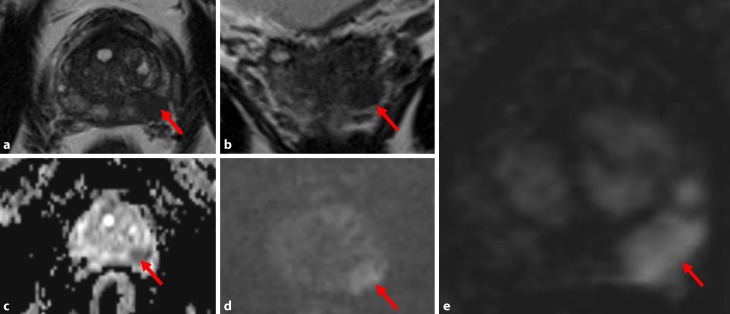
Fig. 1.
Prostate carcinoma in the peripheral zone (red arrow): hypointensity on axial T2-weighted (a) and on follow-up T2-weighted images (b); hypointensity on ADC (Apparent Diffusion Coefficient) maps (c) and hyperintensity on diffusion-weighted images (d); marked early contrast enhancement on dynamic contrast-enhanced sequences (e)

