
Figure 3.
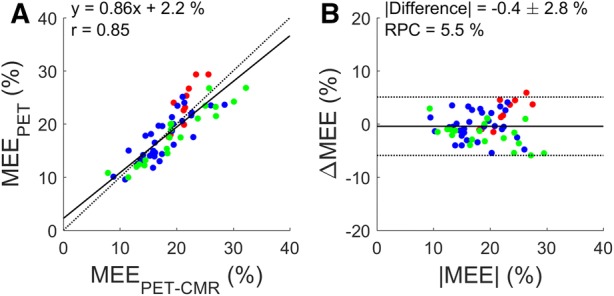
Correlation (A) and Bland Altman plot (B) of myocardial external efficiency based on a combined PET-CMR protocol (MEEPET-CMR) and PET-only (MEEPET). Black and gray lines indicate the line of identity and the linear fit in (A) and the mean difference and the 95% confidence interval in (B). RPC: repeatability coefficient. Red: healthy controls (n = 10), blue: AVS patients (n = 33), green: MVR patients (n = 20)