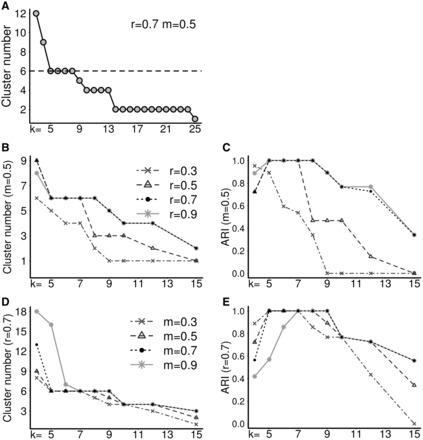
Fig. 2.

The effects of parameters on the clustering results of the synthetic dataset shown in Figure 1A. (A) The number of clusters detected as a function of k. (B–E) The number of clusters and ARI (see Supplementary Text for how it is calculated) at different parameter settings
