
Figure EV1. Calcineurin affects cyclin B2 and XErp1 degradation at meiotic exit.
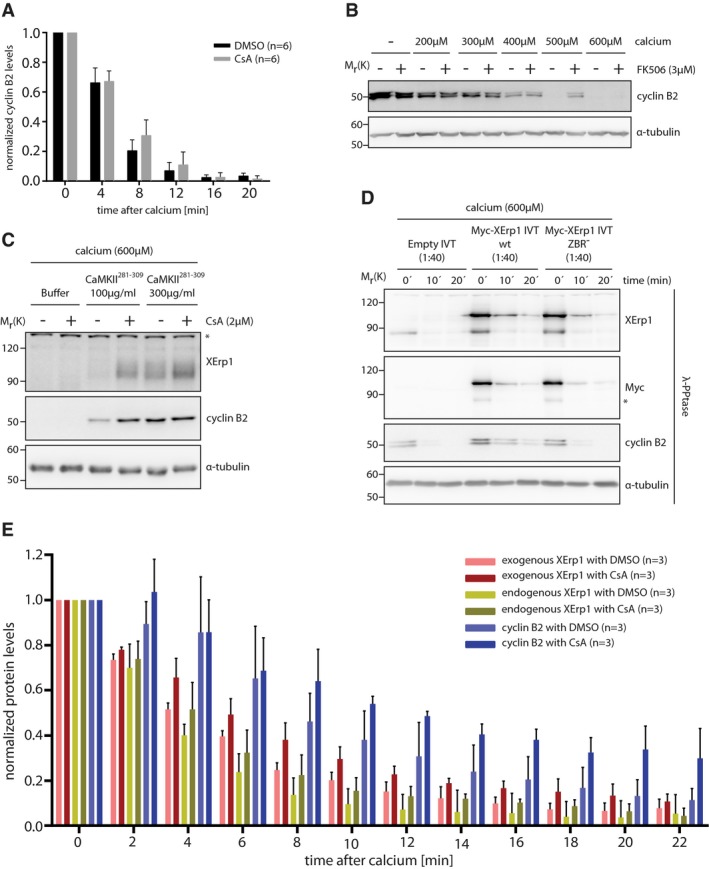
- Quantification of cyclin B2 degradation in DMSO‐ or CsA‐treated CSF extracts after calcium addition as shown in Fig 1B. Values were normalized to t = 0 min and are given as mean ± standard deviation of six independent biological replicates. The P‐value for the 8 min timepoint (DMSO/CsA) is 0.08 (unpaired two‐sided t‐test with unequal variance).
- CSF extract was treated with DMSO or FK506. Both reactions were divided and supplemented with the indicated amounts of calcium or H2O. After 20 min, samples were taken and immunoblotted for cyclin B2. The cyclin B2 membrane was stripped and reprobed for α‐tubulin.
- CSF extract was treated with control buffer or the indicated amounts of CaM Kinase II Inhibitor 281–309 (CaMKII281–309). Extracts were divided and treated with DMSO or CsA before addition of calcium. After 15 min, samples were taken and immunoblotted for XErp1 and cyclin B2. The cyclin B2 membrane was stripped and reprobed for α‐tubulin. Asterisk indicates unspecific bands.
- CSF extract was treated with Myc‐XErp1 IVT that was either wild‐type or mutated to alanine at C583 (ZBR−). An empty IVT not expressing XErp1 was added as control. Meiotic exit was induced by addition of calcium, and samples were taken at the indicated time points, treated with λ‐phosphatase and immunoblotted for XErp1, the Myc‐tag, cyclin B2, and α‐tubulin. Asterisk indicates unspecific bands.
- Quantification of exogenous XErp1, endogenous XErp1, and cyclin B2 in DMSO‐ or CsA‐treated CSF extracts after calcium addition as shown in Fig 1E. Values were normalized to t = 0 min and are given as mean ± standard deviation of three independent biological replicates. The P‐values for the 8 min timepoint are 0.07 (exo. XErp1, DMSO/CsA), 0.26 (endo. XErp1, DMSO/CsA), and 0.17 (cyclin B2, DMSO/CsA) using an unpaired two‐sided t‐test with unequal variance.
Source data are available online for this figure.