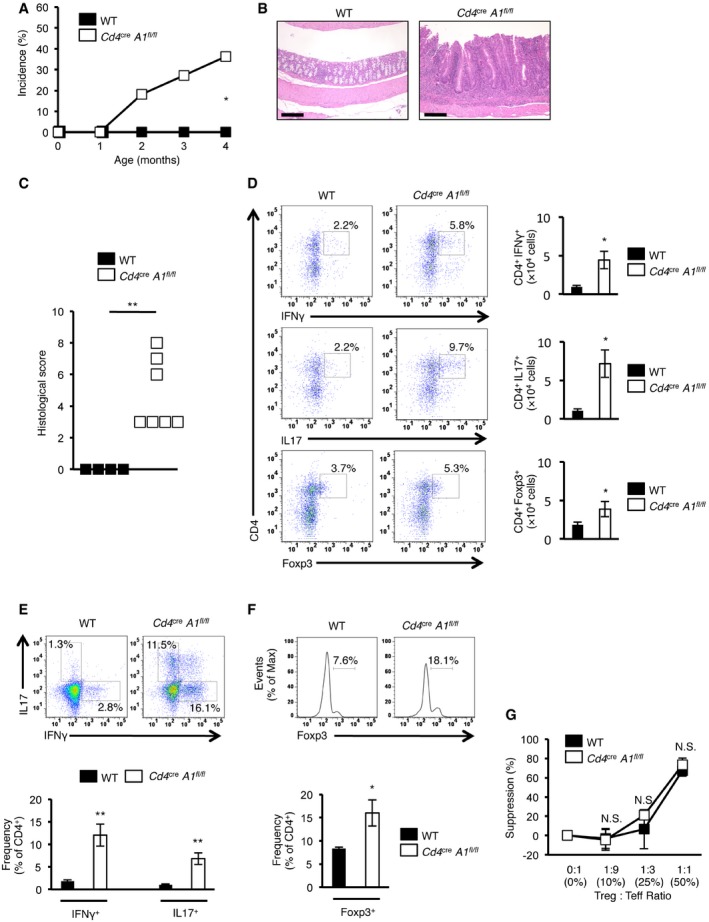
Incidence of spontaneous colitis observed in wild‐type (WT) and CD4+ cell‐specific Adar1 knockout (Cd4
cre
A1
fl/fl) mice (n = 11 for each group; Fisher's exact test, *P < 0.05).
Representative images of HE staining of the colon dissected from a WT and Cd4
cre
A1
fl/fl mouse. Scale bar, 200 μm.
Histological scores for colitis were compared between WT (n = 4) and Cd4
cre
A1
fl/fl (n = 7) mice (Mann–Whitney U‐test, **P < 0.01).
Lymphocytes isolated from the colonic lamina propria of WT and Cd4
cre
A1
fl/fl mice were stained with anti‐IFNγ, anti‐IL17, or anti‐Foxp3 antibodies together with anti‐CD4 antibodies and analyzed by flow cytometry. Representative images are shown (left panel). The absolute number of IFNγ‐, IL17‐, or Foxp3‐expressing CD4+ T cells was compared between WT and Cd4
cre
A1
fl/fl mice (right panel). Values are displayed as the mean ± SEM (n = 3 for each group; Mann–Whitney U‐test, *P < 0.05).
Splenocytes isolated from WT and Cd4
cre
A1
fl/fl mice were stained with anti‐IFNγ and anti‐IL17 together with anti‐CD4 antibodies and were gated on CD4+ cells. Representative flow cytometric images are shown (upper panel). The percentages of IFNγ‐ and IL17‐secreting CD4+ T cells were compared between WT and Cd4
cre
A1
fl/fl mice (lower panel). Values are displayed as the mean ± SEM (n = 6 for each group; Mann–Whitney U‐test, **P < 0.01).
Splenocytes isolated from WT and Cd4
cre
A1
fl/fl mice were stained with anti‐Foxp3 together with anti‐CD4 antibodies and were gated on CD4+ cells. Representative flow cytometric images are shown (upper panel). The percentages of Foxp3‐expressing CD4+ T cells were compared between WT and Cd4
cre
A1
fl/fl mice (lower panel). Values are displayed as the mean ± SEM (n = 4 for each group; Mann–Whitney U‐test, *P < 0.05).
Effector T (Teff) cells isolated from the spleen of a WT mouse were stimulated with soluble anti‐CD3 (5 μg/ml) in the presence of mitomycin C‐treated splenocytes and were cultured with regulatory T (Treg) cells isolated from WT and Cd4
cre
A1
fl/fl mice at the indicated ratios. After 72 h, the proliferative activity was measured. Values are displayed as the mean ± SEM (n = 3 for each group; Mann–Whitney U‐test, N.S., not significant). The mean value for the suppression of proliferative activity of Teff cells in a condition without Treg cells was set as 0%.

