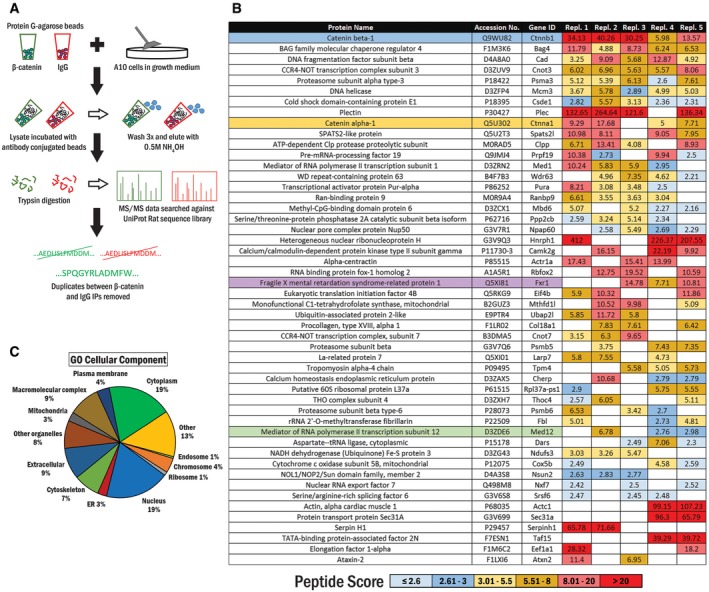
Figure 1. Schematic of experimental workflow and top 50 sorted β‐catenin interactors shown with GO cellular component analysis.

- Workflow for identification of the β‐catenin interactome in A10 cells.
- The list of potential β‐catenin interacting partners. β‐Catenin (blue) is present in all replicates. Previously reported cytoplasmic and nuclear interacting partners, α‐catenin and Mediator 12, are highlighted in yellow and green, respectively. FXR1, which shares a high sequence and domain homology with FMRP, is highlighted in purple.
- A first‐level gene ontology (GO) domain analysis of the top 50 candidates in the GO domain “cellular component”. The percentage of proteins associated with each GO term of the respective domain is represented in the pie chart.
