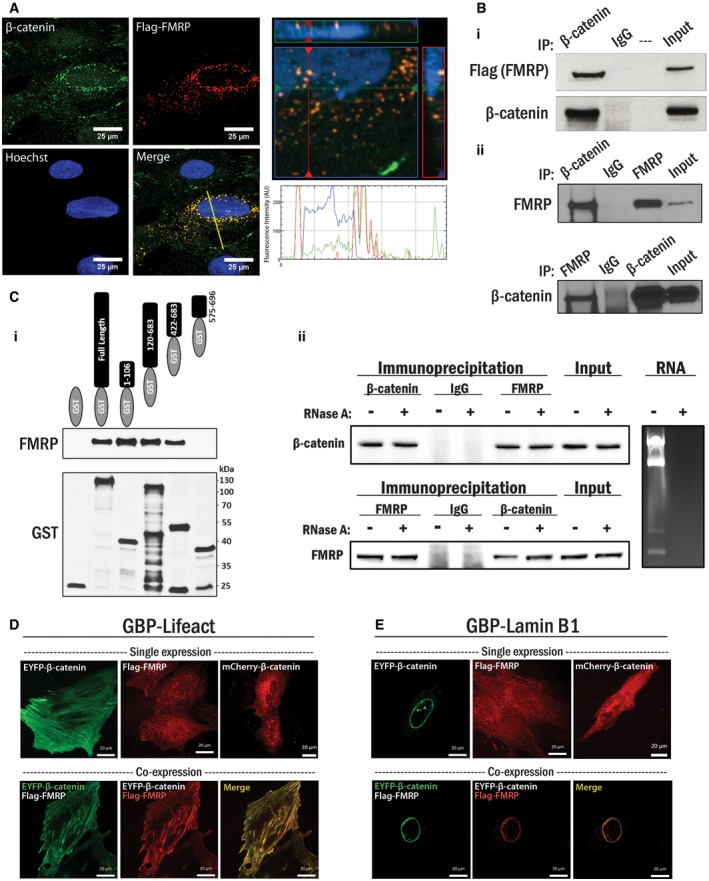
(Left panel) A10 cells were transfected with Flag‐FMRP for 3 h then cultured for 24 h prior to fixation and staining for β‐catenin (green), Flag (FMRP, red), and nucleus (blue). (Bottom right panel) A line was drawn through a representative cell to indicate relative intensity of RGB signals. (Top right panel) An orthogonal projection was generated by a Z‐stack (240 nm interval) image set using the ZEN program (Zeiss) depicting the region surrounding the nucleus in the XY, XZ, and YZ planes.
(i) HEK 293T cells were transfected with Flag‐FMRP as in (A), and endogenous β‐catenin protein complexes were immunoprecipitated with β‐catenin antibody. Co‐immunoprecipitated Flag‐FMRP protein was detected by Western blot analysis with the Flag antibody. Non‐programmed rabbit IgG was used as a control. (ii) Primary VSMCs were harvested and subjected to an endogenous coIP analysis with either β‐catenin or FMRP antibody. The corresponding protein was detected in the precipitated immunocomplex by Western blot. Non‐programmed rabbit IgG was used as a control.
(i) Purified 6x‐His‐FMRP and various regions of β‐catenin proteins fused to GST were incubated with glutathione‐agarose beads. Purified GST or GST‐fusion proteins were visualized by Western blotting using the GST antibody, and sizes of corresponding GST‐fusion proteins were confirmed. Pulled‐down FMRP proteins by GST fused β‐catenin were detected by immunoblotting with the FMRP antibody. (ii) Interaction between FMRP and β‐catenin was assessed in the presence or absence of RNA. HEK 293T cells were subjected to an endogenous coIP analysis using either β‐catenin or FMRP antibody, in the presence or absence of RNase A (10 μg/ml). The corresponding protein was detected in the precipitated immunocomplex by Western blot, and non‐programmed rabbit IgG was used as a control. RNA was extracted from parallel cultured cells, and total RNA content was analyzed by agarose gel electrophoresis in the presence or absence of RNase A.
(Top panel) A10 cells were transfected with GBP‐Lifeact and either EYFP‐β‐catenin, Flag‐FMRP, or mCherry‐β‐catenin. The cells were fixed and subjected to either fluorescence microscopy or immunofluorescent staining for Flag (red), as indicated. (Bottom panel) A10 cells were transfected with GBP‐Lifeact similar to above, but with both EYFP‐β‐catenin and Flag‐FMRP, and the cells were subjected to fluorescent microscopy and immunofluorescent staining for Flag (red). Scale bars, 20 μm.
A10 cells were transfected as in (D) with GBP‐lamin B1. Scale bars, 20 μm.

