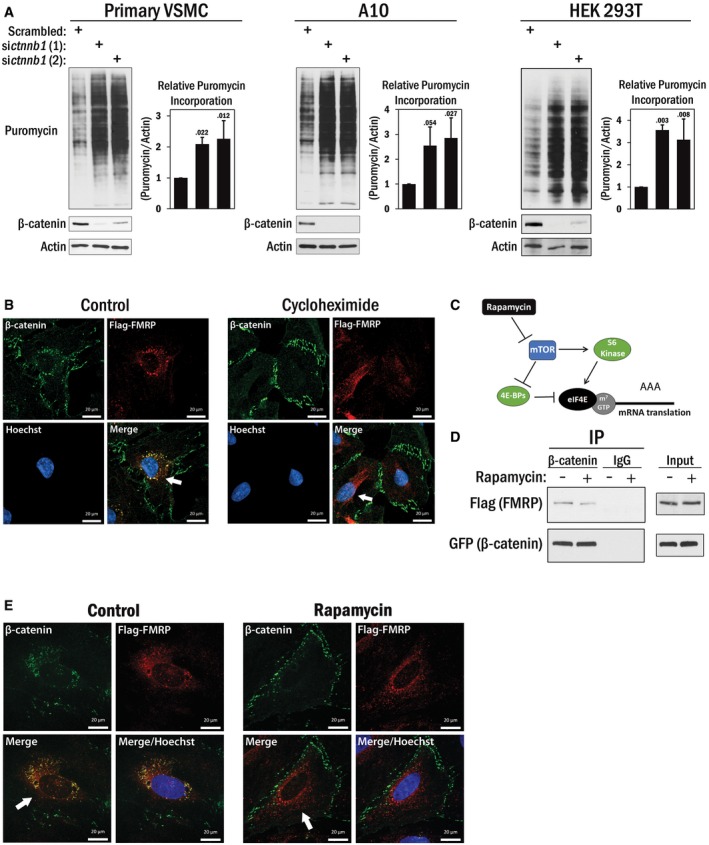
Figure 5. β‐Catenin inhibits translation.

- Primary VSMCs (left panel), A10 (middle panel), and HEK 293T cells (right panel) were transfected with siRNAs targeting ctnnb1 (β‐catenin) or scrambled RNA. After 36 h, the cells were pulsed with 0.5 μM puromycin for 15 min and then harvested. The puromycin incorporated peptides were detected by Western blot analysis with puromycin antibody. β‐Catenin blots indicated efficacy of siRNA, and actin was used as a loading control. The average puromycin/actin ratio (n = 3) is shown in the graphs to the right of each cell type, and the error bars indicate standard deviation. A one‐way ANOVA and Tukey post hoc test were performed, with P‐values indicated above the error bars.
- A10 cells were transfected with Flag‐FMRP then treated with either cycloheximide or its solvent (DMSO) for 4 h prior to fixation. β‐Catenin (green) and Flag (FMRP, red) were visualized by immunofluorescence. Nucleus (blue) was identified by DNA staining with Hoechst 33342. Arrows indicate a loss of β‐catenin signal from the perinuclear region that was seen in the control following cycloheximide treatment. Scale bars, 20 μm.
- Schematic depiction of rapamycin‐mediated inhibition of cap‐dependent translation.
- A10 cells were transfected with Flag‐FMRP as above and then pre‐treated with rapamycin or solvent (DMSO) for 1 h in serum‐free media. Serum was added for 2 h before the cells were harvested and subjected to coIP analysis using β‐catenin antibody. Non‐programmed rabbit IgG was used as a control. Existence of Flag‐FMRP in the immunocomplex was detected by Flag antibody and β‐catenin by GFP antibody.
- A10 cells were transfected with Flag‐FMRP followed by rapamycin treatment similar to (D). Cells were fixed and stained for β‐catenin (green), Flag (FMRP, red), and nucleus (blue). A loss of β‐catenin signal from the perinuclear region that was seen in the control is indicated by the arrows. Scale bars, 20 μm.
Source data are available online for this figure.
