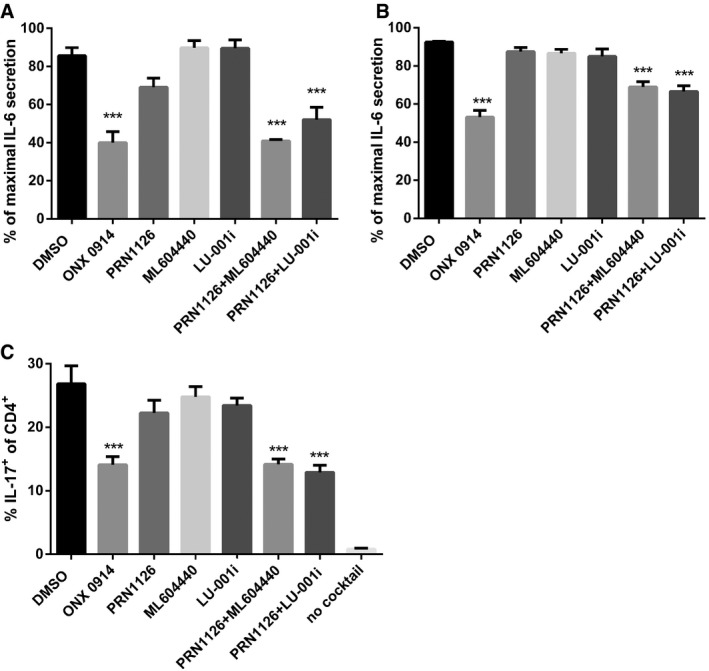
The differentiation of CD4
+ T cells isolated from the spleens of C57BL/6 mice that were exposed (continuous treatment) to DMSO, ONX 0914 (300 nM), PRN1126 (300 nM),
ML604440 (300 nM), LU‐001i (300 nM), PRN1126 +
ML604440 (300 nM each), or PRN1126 + LU‐001i (300 nM each) and that were stimulated with plate‐bound antibodies to CD3/CD28 in the presence of TGF‐β and IL‐6 and scavenging antibodies neutralizing IL‐4 and IFN‐γ was measured in 3‐day cultures. IL‐17 expression was detected by intracellular cytokine staining after a short restimulation with PMA/ionomycin. IL‐17 expression in activated T cells cultured in the absence of Th17‐polarizing conditions is shown as a comparison (no cocktail). Values reflect the percentage of CD4
+ cells that are IL‐17A
+. Data are presented as the means ± s.e.m. of three independent experiments each measured in triplicates. All data were statistically compared to the DMSO‐treated group. ***
P < 0.001. One‐way ANOVA.

