
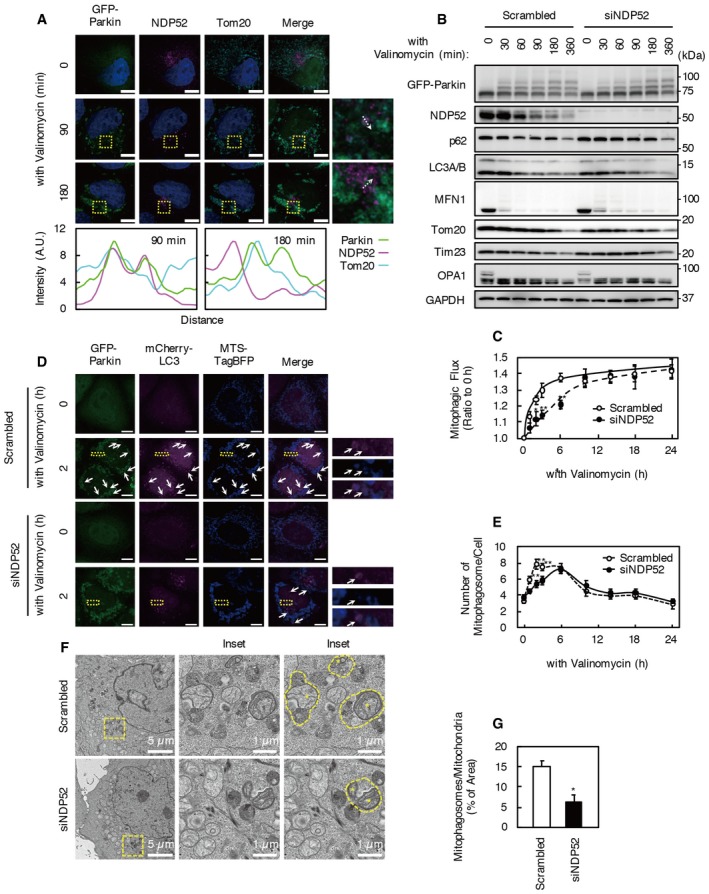
Figure 1. Mitophagosome formation is reduced by NDP52 knockdown.
-
AHeLa cells stably expressing GFP‐Parkin (HeLa‐GFP‐Parkin cells) were treated with 1 μM valinomycin and immunostained with anti‐NDP52 and anti‐Tom20 antibodies. Boxed areas in the images are shown in the next panels on the right. Colocalization of GFP‐Parkin, NDP52, and Tom20 was determined using Line Scan. Fluorescence intensities of each channel were measured along the dotted white arrow. Scale bars, 10 μm. Images are representative of three independent experiments.
-
BHeLa‐GFP‐Parkin cells were transfected with siNDP52 or scrambled siRNA. Seventy‐two hours after transfection, cells were incubated with 1 μM valinomycin for the indicated times. Western blotting was performed using the indicated antibodies. Data are representative of three independent experiments.
-
CMitophagy flux assay using Mtphagy dye. Increase in Mtphagy dye fluorescence intensity indicates the recruitment of mitochondria to lysosomes during valinomycin treatment. Results are a summary of three independent experiments. Values are the means ± SEM. *P < 0.05, **P < 0.01 compared with scrambled oligo‐treated cells, determined with one‐way ANOVA followed by the Student's t‐test.
-
DFluorescence images of NDP52 KD and control cells expressing mCherry‐LC3 and MTS‐TagBFP. Arrows indicate mCherry‐LC3 puncta colocalized with MTS‐TagBFP. Scale bars, 10 μm. Boxed areas in images are shown in the next panels on the right. Images are representative of four independent experiments.
-
EThe number of mCherry‐LC3 puncta colocalized with MTS‐TagBFP (representing mitophagosomes) per cell was counted. Results were from at least six microscopic fields of three independent experiments. Values are the means ± SEM. **P < 0.01 compared with scrambled oligo‐treated cells, determined with one‐way ANOVA followed by the Student's t‐test.
-
F, GElectron micrographs of NDP52 KD and control cells. Asterisks indicate mitochondria sequestered by autophagosomes (mitophagosomes, yellow dotted line). The ratios of mitophagosomes per mitochondrial area are shown in (G). Ten cells from three independent experiments were counted. Values are the means ± SD. *P < 0.05 compared with scrambled oligo‐treated cells, determined with one‐way ANOVA followed by the Student's t‐test.
Source data are available online for this figure.