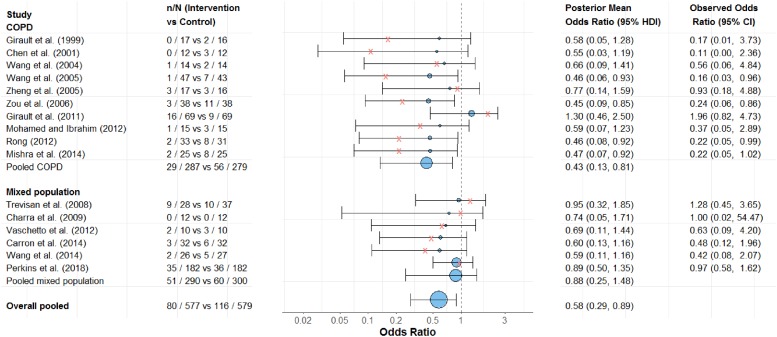
Fig. 3.
Forest plot comparing hospital mortality rates for NIV and invasive weaning, by patient population (COPD vs. mixed ICU population). The estimated odds ratio (OR) from the posterior distribution for each study is shown as a circle, with 95% HDI represented by horizontal lines. The observed OR are given by crosses. The pooled OR estimates (and 95% HDI) are also displayed as the last row for each patient population, and the overall pooled estimate for all studies is displayed as the last row. An OR < 1 means that the intervention is superior

