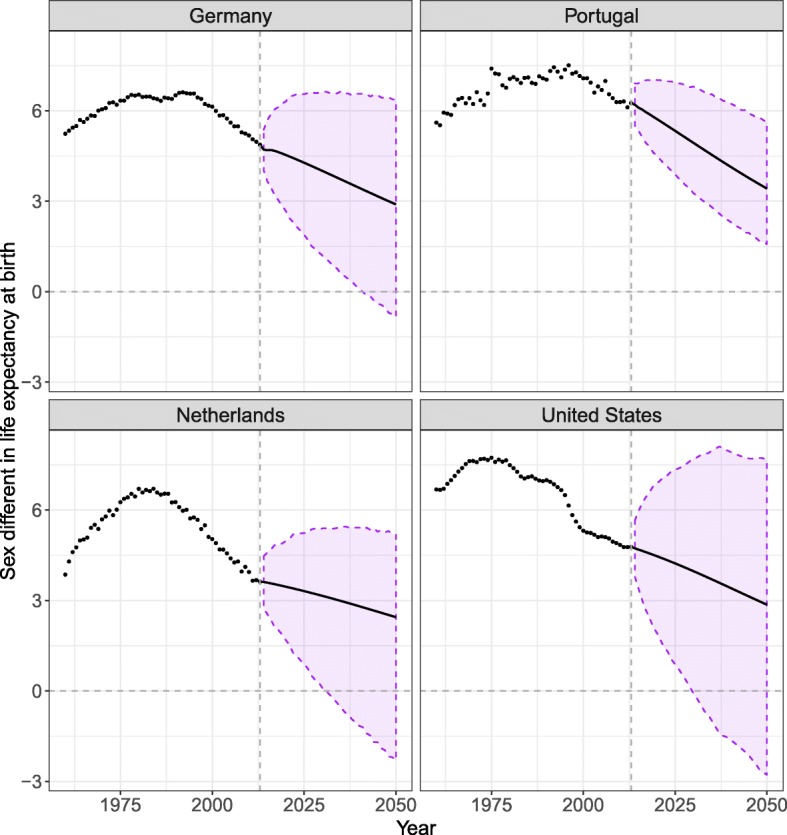
Fig. 10.

Sex differences in life expectancy at birth observed (dots) and forecast (lines) from 2013 to 2050 resulting from forecasting females’ mortality with the CoDaCC model and that of males with the SR-CoDaCC model, with the 80% prediction intervals, for Germany, the Netherlands, Portugal, and the United States
