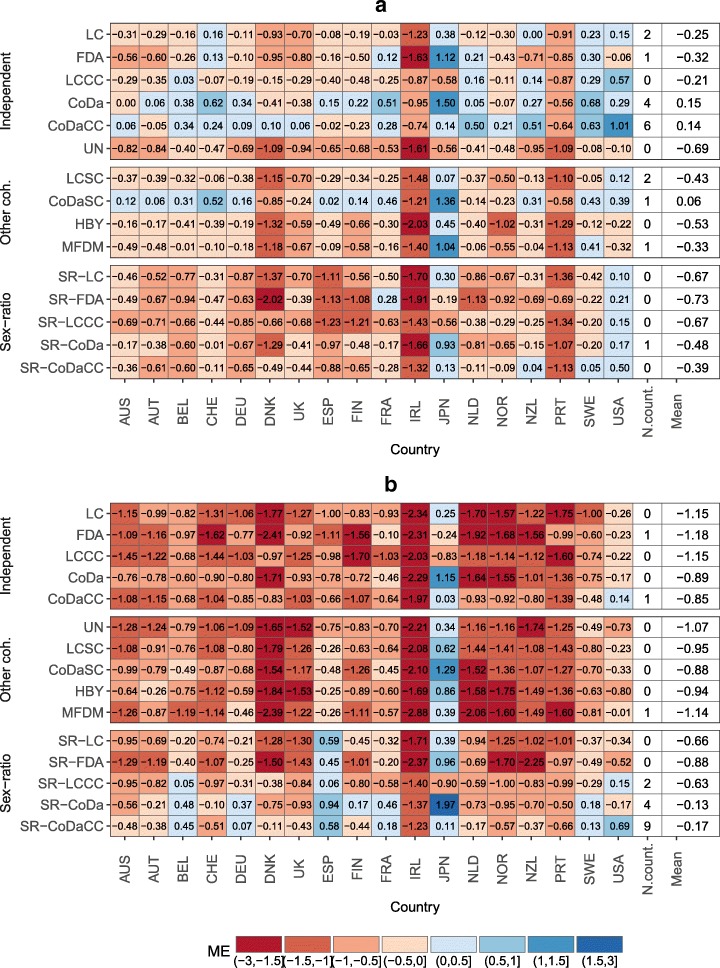
Fig. 7.
Mean error (ME) on forecasting the life expectancy at birth using different models (and prior models for of the opposite sex the sex ratio) for the period 1999–2013, mean over countries by model and number of countries with the lowest ME by model, 18 industrialized countries. a Females and b Males

