Fig. 1.

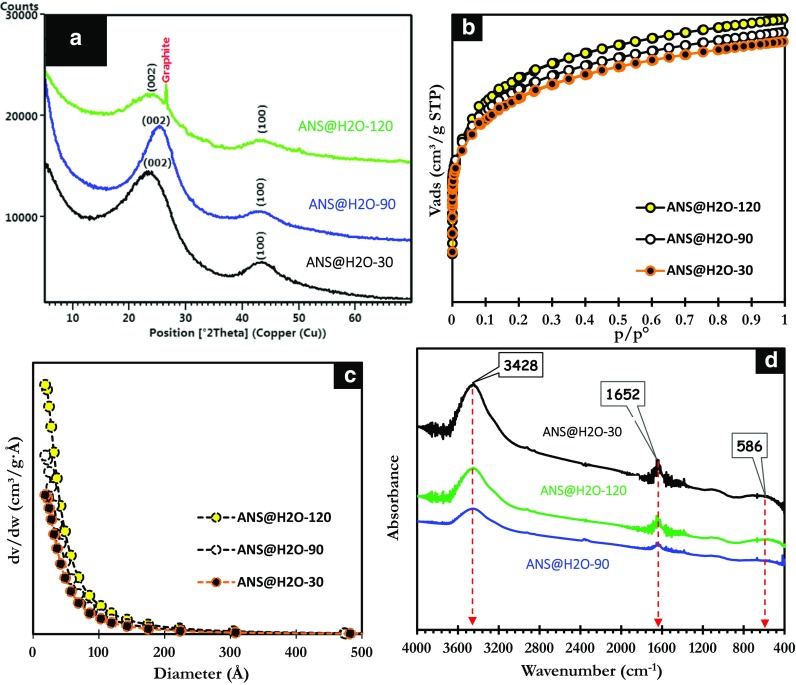
a X-ray diffractograms. b Adsorption isotherms. c Pore size distributions. d FTIR spectra of ANS@H2O-30, ANS@H2O-90, and ANS@H2O-120

a X-ray diffractograms. b Adsorption isotherms. c Pore size distributions. d FTIR spectra of ANS@H2O-30, ANS@H2O-90, and ANS@H2O-120