
Fig. 1.
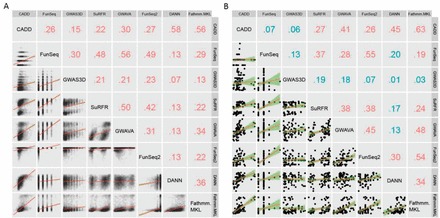
SRC among eight tools for (A) refined causal dataset and (B) curated experimentally validated dataset. Numbers indicate the correlation coefficients; Lines indicate linear fitting; Line range indicates y range with continuous x values (Color version of this figure is available at Bioinformatics online.)