
Fig. 3.
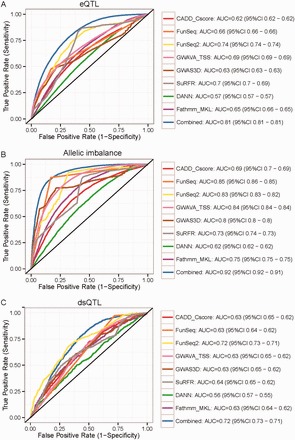
Performance of regulatory QTLs prediction from different methods. ROC curves on (A) eQTLs dataset; (B) allelic imbalanced dataset; (C) dsQTLs dataset (Color version of this figure is available at Bioinformatics online.)
Official websites use .gov
A
.gov website belongs to an official
government organization in the United States.
Secure .gov websites use HTTPS
A lock (
) or https:// means you've safely
connected to the .gov website. Share sensitive
information only on official, secure websites.
Performance of regulatory QTLs prediction from different methods. ROC curves on (A) eQTLs dataset; (B) allelic imbalanced dataset; (C) dsQTLs dataset (Color version of this figure is available at Bioinformatics online.)