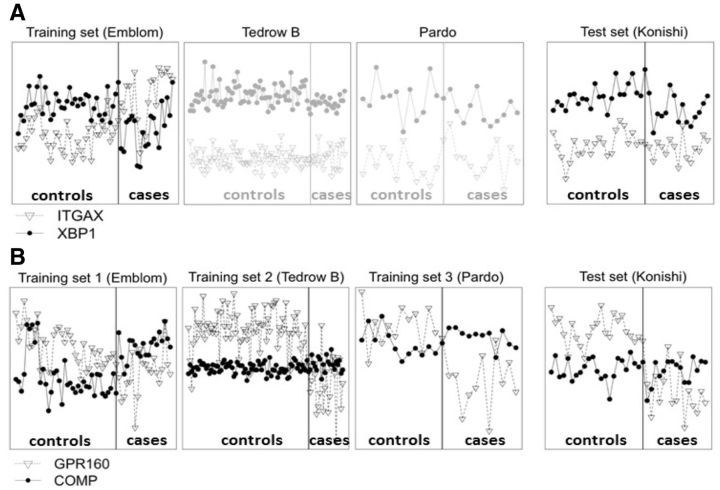
Fig. 1.
Two TSP examples from real data to show advantage of MetaTSP. X-axis and Y-axis refer to sample indices and gene expression levels, respectively. (A) Gene pair ITGAX/XBP1 has high TSP score (XBP1 > ITGAX in controls but ITGAX > XBP1 in cases) in the training ‘Emblom’ study but fail to replicate in the testing ‘Konishi’ study as well as the other two Tedrow B and Pardo studies. (B) Gene pair GPR160/COMP has high TSP scores (GPR160 > COMP in controls and COMP > GPR160 in cases) in all three training studies ‘Emblom’, ‘Tedrow B’ and ‘Pardo’. The gene pair is successfully validated in the testing ‘Konishi’ study

