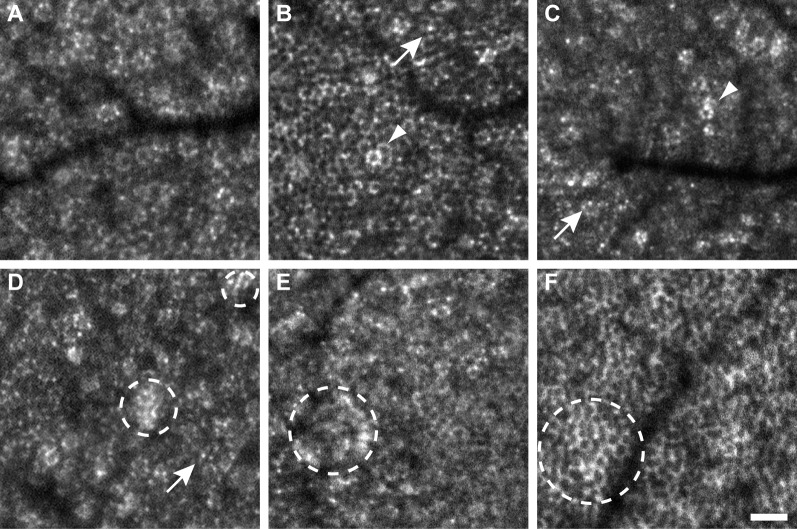
Figure 1.
Variations in RPE cell morphology visualized with SWAF. Cell boundaries consisted of distinct punctate spots of AF (e.g., A, D), presumably individual lipofuscin granules (arrows), or more complete rings of AF (e.g., B, F). Individual hyper-AF cells (arrowheads) and hyper-AF patches (dashed circles) were observed. (A–F) From participants NOR064, NOR053, NOR057, NOR063, NOR047, and NOR073, respectively. Scale bar: 50 μm.

