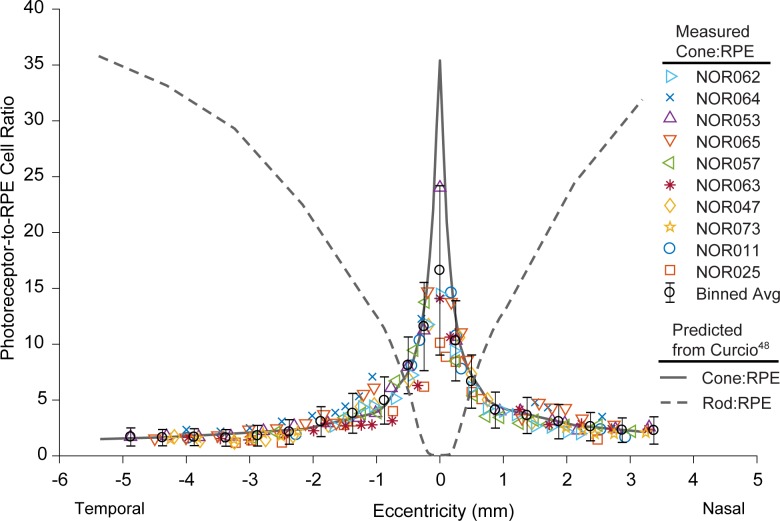
Figure 4.
Plot of measured cone-to-RPE cell ratio across the macula, showing individual participant ROI data (colored markers) and binned and averaged data (black circles). The shape and interparticipant variability are dominated by cone density rather than RPE density. With the exception of foveal center, our data agree with the expected ratio (solid gray line), generated by using previously published cone density data48 and the RPE density data in this study. The theoretical rod-to-RPE ratio curve (dashed gray line) is also shown for reference, generated by using published rod density data.48

