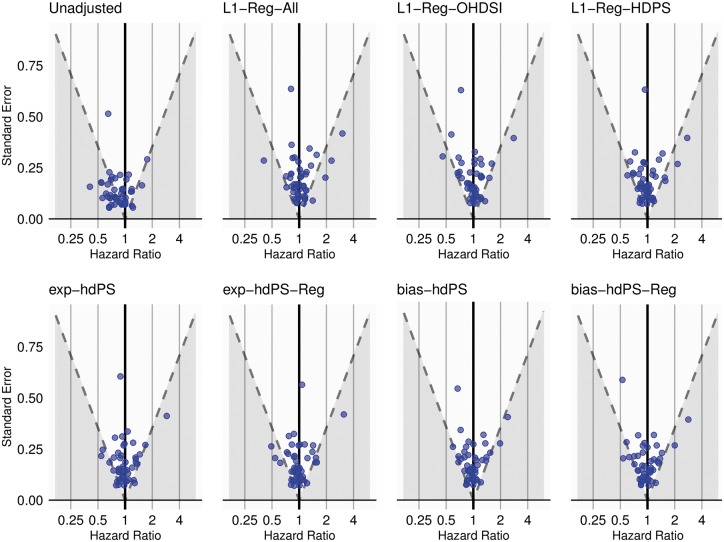
Figure 4.
Anticoagulants study: hazard ratio estimates (horizontal axis) and width of 95% confidence interval (via standard error) (vertical axis) for 49 negative control outcomes. Dashed line represents the straight line boundary at where the 95% confidence interval does (above) or does not (below) contain the assumed true hazard ratio of 1.

