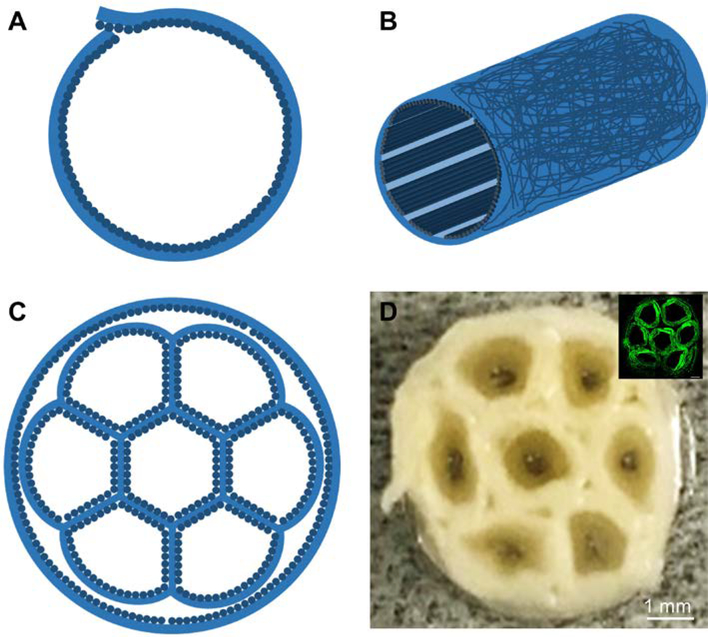
Figure 1.
Schematics showing (A) the cross-sectional and (B) side views of a single tube with a bilayer structure for the wall, which is comprised of random fibers as the outer layer and uniaxially aligned fibers as the inner layer, and (C) the cross-section of a multi-tubular conduit consisting of seven small tubes within the lumen of a large tube. (D) Photograph of the cross section of a multi-tubular conduit. The inset shows the fluorescence micrograph of the cross section of a conduit after the adsorption of FITC-BSA.

