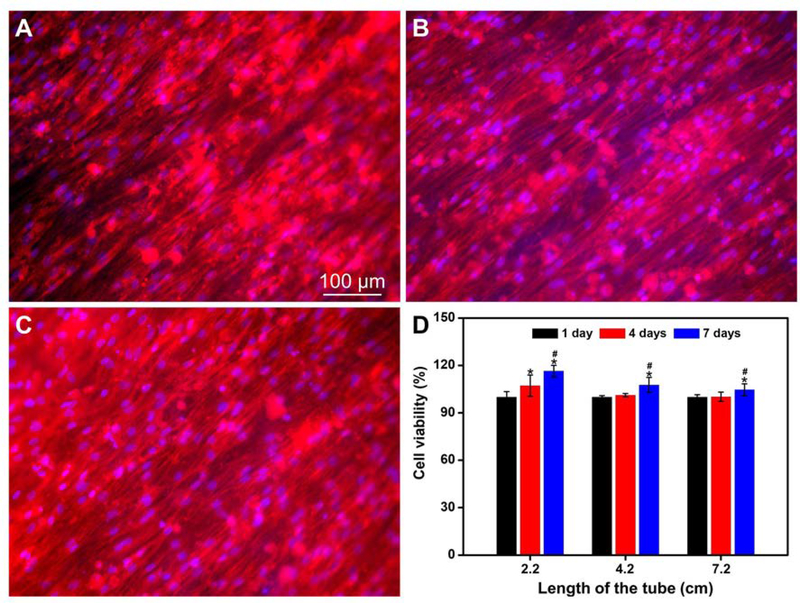
Figure 3.
Fluorescence micrographs of the BMSCs after incubation in the multi-tubular conduit (length = 4.2 cm) for 7 days. The small tubes were cut open and then the F-actins of the cells were stained with Alexa Fluor 555 phalloidin (red) while the cell nuclei were stained with DAPI (blue). The images were captured from the middle region of the small tubes, which were located (A) at the center and (B, C) in the periphery at opposite sites of the conduit, respectively. (D) Viabilities of BMSCs after incubation in the conduit with lengths of 2.2, 4.2, and 7.2 cm for different periods of time. *P < 0.05 compared with that at 1 day (n = 3). #P < 0.05 compared with that at 4 days (n = 3).

