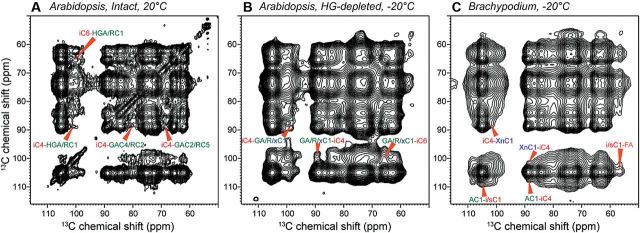
Fig. 2.
2D 13C-13C PDSD spectra of plant cell walls measured with 1.5 s spin diffusion mixing. (A) Intact Arabidopsis cell wall at 20 °C. (B) HG-depleted Arabidopsis cell wall at −20 °C. (C) Brachypodium cell wall at −20 °C. Cellulose–pectin cross peaks are observed in both intact and HG-depleted Arabidopsis cell walls, and cellulose–GAX cross peaks are detected in the Brachypodium sample.

