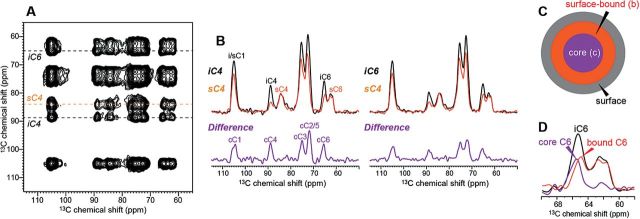
Fig. 3.
(A) 2D 13C-13C PDSD spectrum of Brachypodium cell wall with a 3.0 s mixing. The spectrum was measured at 20 °C with a short 1H-13C CP contact time of 35 μs to suppress the signals of mobile GAX. (B) Representative cross sections of interior cellulose (black) and surface cellulose (orange). The different intensity patterns indicate that 13C magnetization has not equilibrated between interior and surface cellulose. The difference spectra (purple), obtained after normalizing the two cross sections by the sC4 peak, correspond to core cellulose chains that are inaccessible to the surface. (C) Illustration of the cellulose microfibril structure, where interior cellulose consists of a surface-bound fraction and a core fraction. (D) The two types of interior cellulose chains have slightly different C6 chemical shifts.

