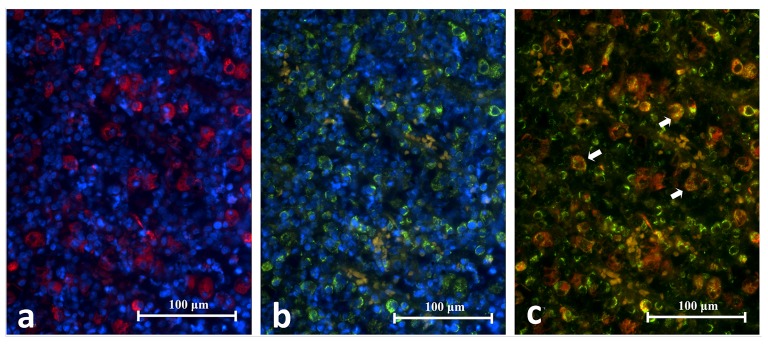
Figure 10. Representative histopathology section of the same area in a periapical granuloma showing images captured under different emitting fluorescence’s.
Image A shows CD68+ cells fluorescing in red and B shows TLR2+ cells fluorescing in green. The superimposed image C reveals the CD68+/TLR2+ cells (white arrows) (CD68/TLR2 Double Immunofluorescence x400).

