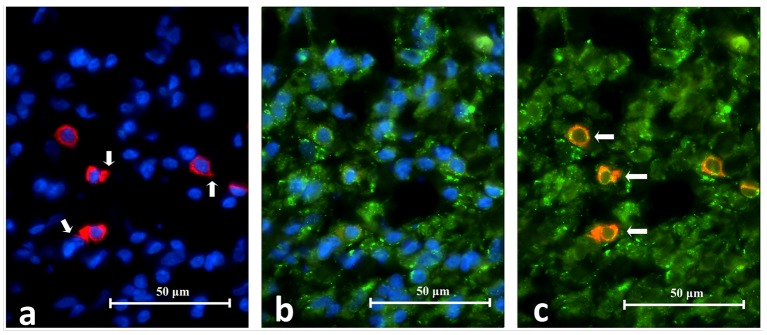
Figure 13. High power magnification images of an area in periapical granuloma captured under individual fluorescence.
Image A shows CD83+ cells fluorescing in red. Notice the cell membrane, cytoplasm and cytoplasmic extension (white arrows) are stained. Image B shows TLR2+ cells fluorescing in green. The superimposed image C reveals CD83+/TLR2+ cells (white arrows) which have cell membrane and cytoplasm fluorescing in orange or a mixture of red and green speckles (CD68/TLR2 Double Immunofluorescence x1000).

