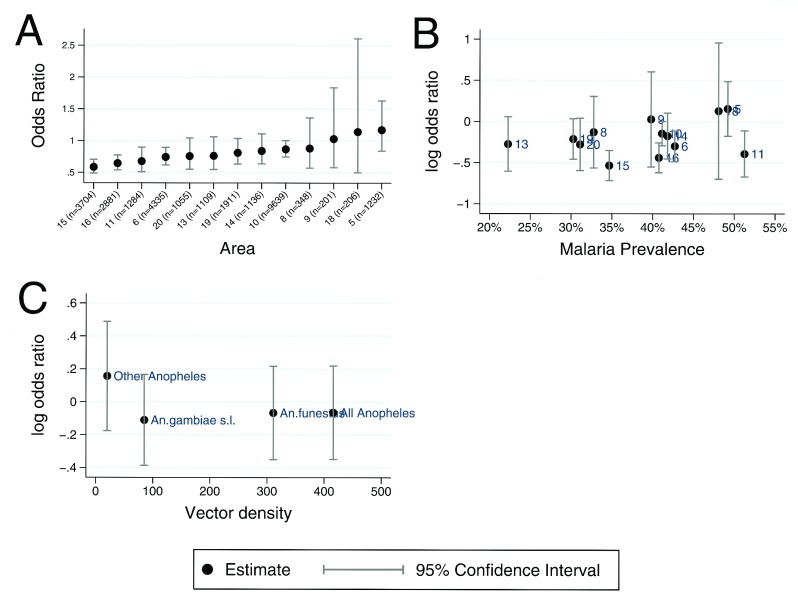
Figure 3.
Panel A shows a scatter plot of stratum specific adjusted Odds Ratio of insecticide treated net (ITN) effect in 13 geographical areas in order of decreasing effectiveness. Panel B shows a scatter plot of the log odds ratio of ITN effect against malaria prevalence in 13 geographical areas. Panel C shows a scatter plot of the log odds ratio of ITN effect against overall mosquito densities and for the 3 separate taxa.

