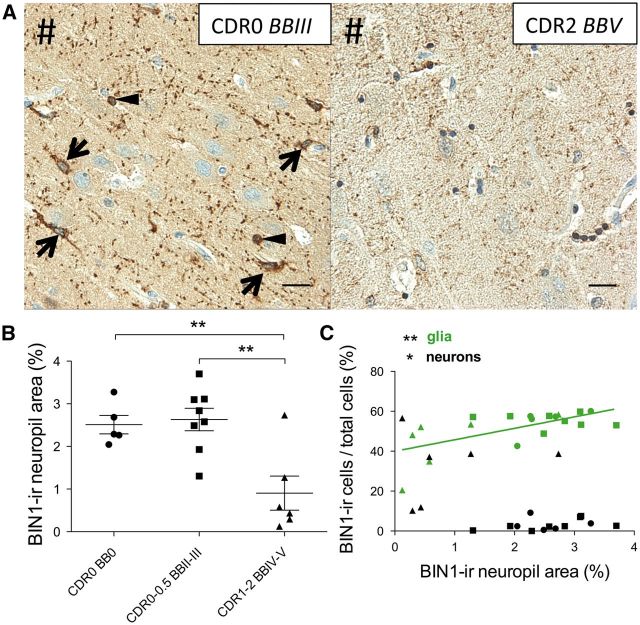
FIGURE 2.
BIN1 immunoreactivity in CA1 neuropil declines in patients with AD. (A) Representative images of BIN1 signal in neuropil of a subject with early NFT accumulation but cognitively intact (CDR0, BBIII), and an AD patient (CDR2, BBV). Note the prominent punctate BIN1-immunoreactive (-ir) neuropil as well as BIN1-ir astrocytes (arrows) and oligodendrocyte (arrowheads) (left panel). In an AD patient, the BIN1 signal is largely reduced in the neuropil (right panel). #Indicates direction of ependymal surface. (B) Area of BIN1-ir neuropil is significantly decreased in patients with AD (CDR1-2, BBIV-V) vs. control and cognitively intact or mildly impaired subjects (CDR0-0.5, BBII-III) (p = 0.002). Mean subject group values marked by horizontal bar; error bars represent SEM. (C) Pearson analysis showing that BIN1-ir neuropil area positively correlates with BIN1-ir glia (p = 0.004), but negatively correlates with BIN1-ir neurons (p = 0.019). Symbols indicate subject group: (•) CDR0, BB0; (▪) CDR0-0.5, BBII-III; (▲) CDR1-2, BBIV-V. Scale bars = 20 μm.

