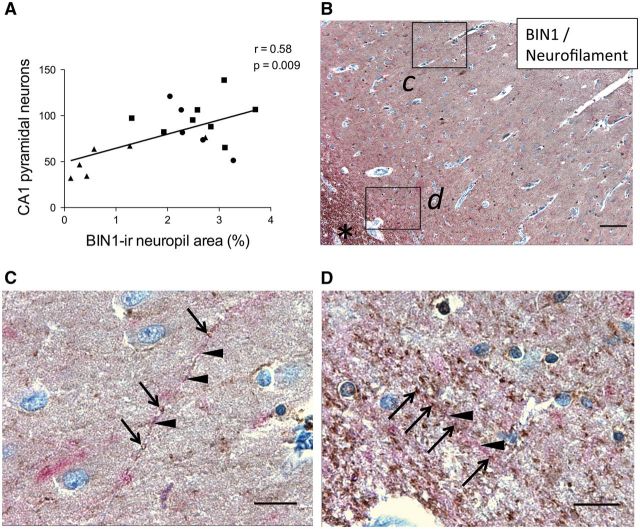
FIGURE 3.
BIN1-immunoreactive (-ir) neuropil signal in CA1 reflects axonal density. (A) Area of BIN1-ir neuropil positively correlates with total number of pyramidal neurons in CA1 (p = 0.009). Symbols indicate subject group: (•) CDR0, BB0; (▪) CDR0-0.5, BBII-III; (▲) CDR1-2, BBIV-V. (B) BIN1 (brown) and neurofilament (red) dual IHC in CA1 with insets c, d. *Indicates alveus. (C) Inset (from area ‘c’ in B ) highlights BIN1-ir neuropil puncta (brown, arrows) along a neurofilament-ir process (red, arrowheads) in CA1. (D) Inset (from area ‘d’ in B ) highlights a similar staining pattern at the junction with alveus. Scale bars: B , 100 μm; C, D , 20 μm.

