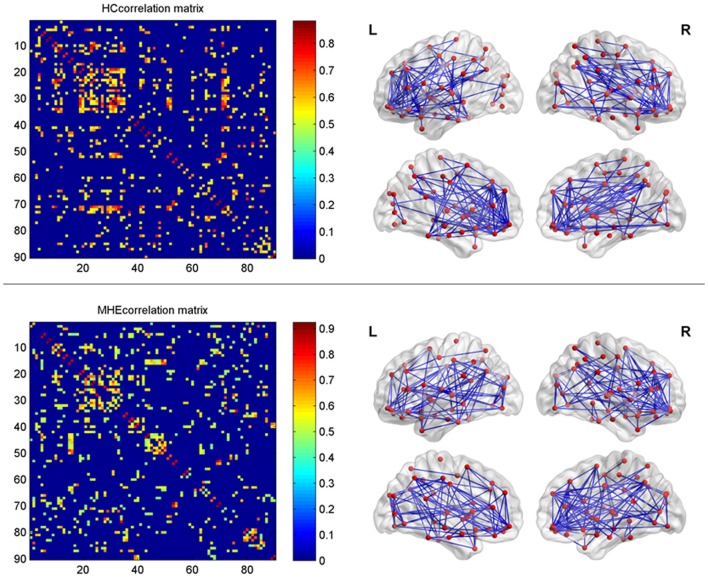
Figure 1.
The interregional correlations matrix in healthy control (HC) and minimal hepatic encephalopathy (MHE) groups. The color bar represents correlation strength. These matrices indicate the maps thresholded at the minimum network density (=12%), wherein the networks depicted full connectivity (without fragmented nodes). The region number (from 1 to 90) represents automated anatomical labeling (AAL) areas, including AMYG.L(R), ANG.L(R), CAL.L(R), CAU.L(R), ACG.L(R), DCG.L(R), PCG.L(R), CUN.L(R), IFGoperc.L(R), ORBinf.L(R), IFGtriang.L(R), ORBsupmed.L(R), MFG.L(R), ORBmid.L(R), SFGdor.L(R), SFGmed.L(R), ORBsup.L(R), FFG.L(R), HES.L(R), HIP.L(R), INS.L(R), LING.L(R), IOG.L(R), MOG.L(R), SOG.L(R), OLF.L(R), PAL.L(R), PCL.L(R), PHG.L(R), IPL.L(R), SPG.L(R), PoCG.L(R), PreCG.L(R), PCUN.L(R), PUT.L(R), REC.L(R), ROL.L(R), SMA.L(R), SMG.L(R), ITG.L(R), MTG.L(R), TPOmid.L(R), TPOsup.L(R), STG.L(R), and THA.L(R). L and R indicate the left and right side, respectively. The right panel shows the graphical representation of the corresponding brain connectivity. The abbreviations for brain regions are presented in Table 2.

