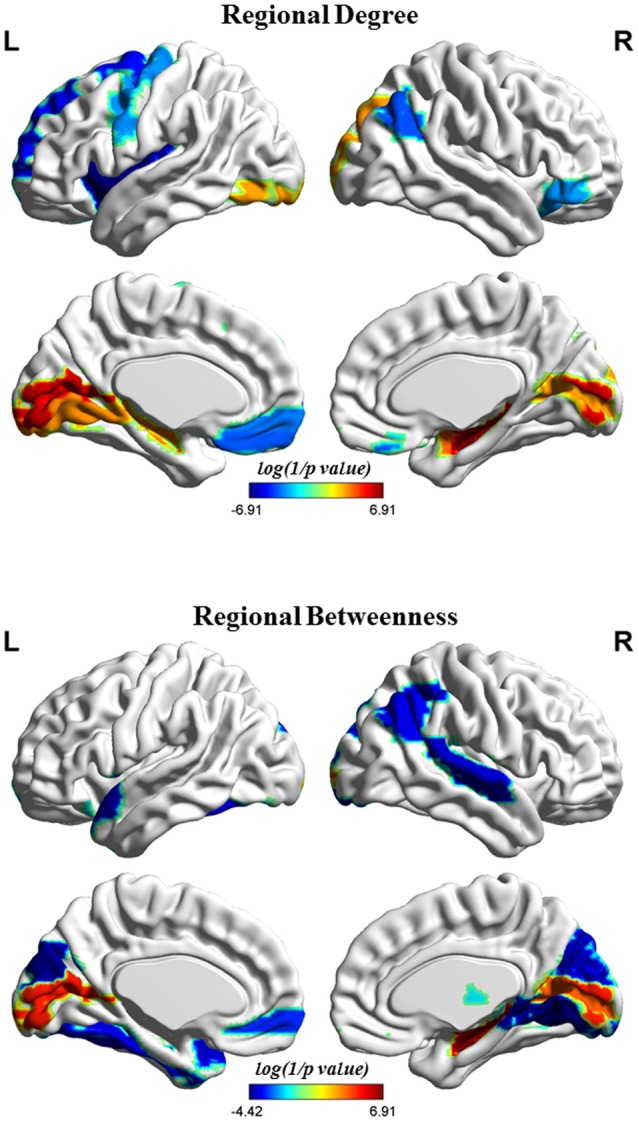
Figure 4.

Brain regions depicting significant alterations in nodal degree and betweenness in the structural covariance network of the gray matter that was thresholded to a minimum density of full connectivity. The color bar indicates the log(1/p value). The cool color signifies regions with higher nodal betweenness or degree among HCs relative to MHE patients, whereas the warm color represents areas with greater nodal betweenness or degree in patients with MHE compared to the HCs. The abbreviations for brain regions are presented in Table 2.
