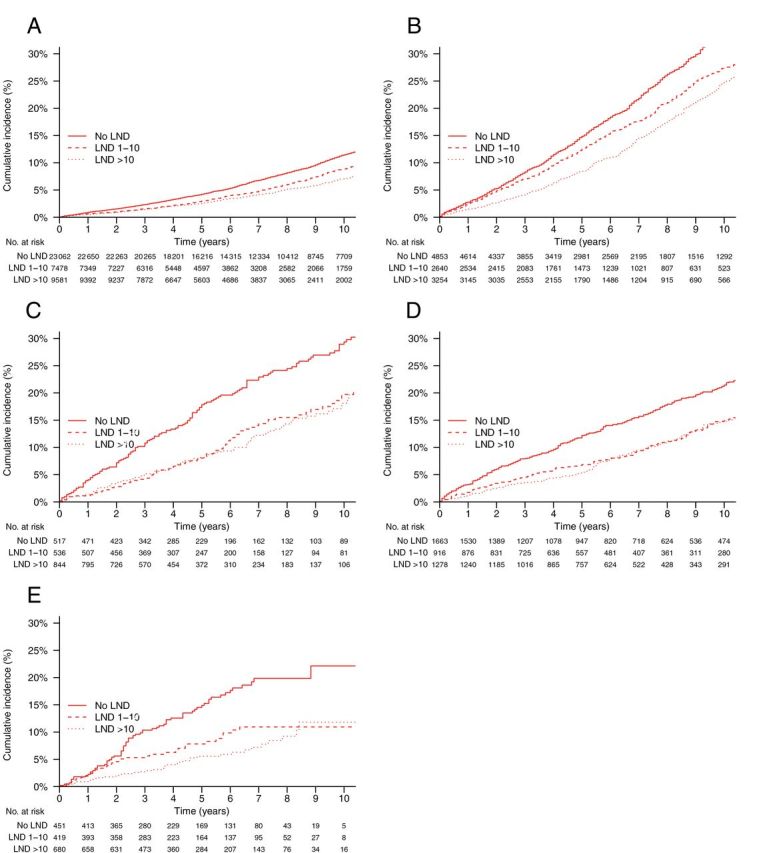
Figure 4.

Cumulative incidences of noncancer mortality (NCM) by lymphadenectomy (LND) and risk group. Gray’s test P values are for overall, LND 1–10 nodes vs no LND, and LND >10 nodes vs no LND, respectively. A ) Low-risk, stage I ( P < .001, P < .001, P < .001). B ) Intermediate-risk, stage I ( P < .001, P < .001, P < .001). C ) High-risk, stage I ( P < .001, P < .001, P < .001). D ) Stage IIA (1988 Fédération Internationale de Gynécologie Obstétrique staging system)/ stage II not otherwise specified ( P < .001, P < .05, P < .001). E ) Stage II ( P < .001, P < .01, P < .001).
