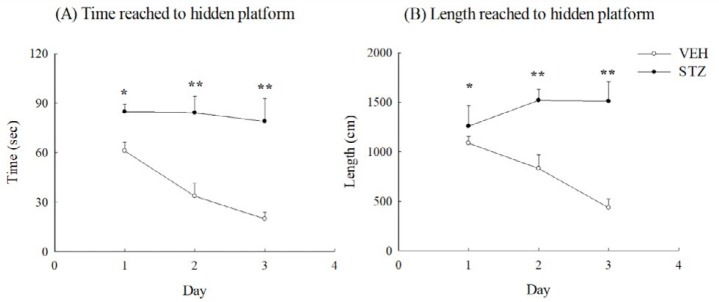
Figure 6.
Spatial performance of Morris water maze from 30 to 32 days after streptozotocin (STZ, 65 mg/kg, IV) injection in rats. (A) Time reached to hidden platform, (B) length reached to hidden platform. Values are expressed as mean±SEM (n=6 in each group). * P<0.05, ** P<0.01 compared to VEH group

