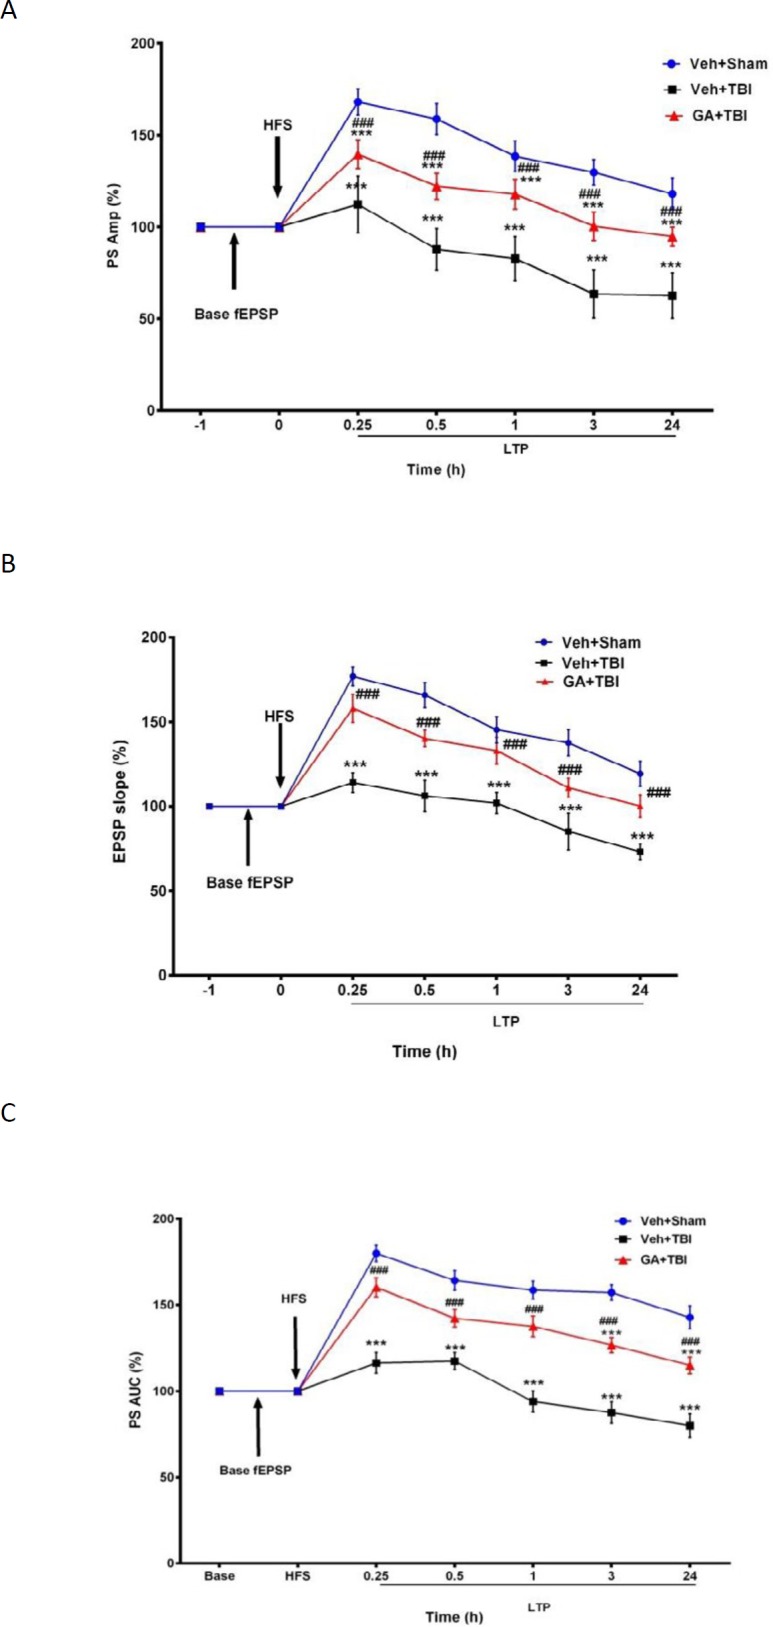
Figure 4.

Mean ± SEM of percentages of amplitude (A), area under curve (B) of population spikes (PSs) and slope of fEPSP (C) in different groups during basal fEPSP and long-term potentiation (LTP) recorded from hippocampal DG at 0.25, 0.5, 1, 3, and 24 hr after high frequency stimulation (HFS) to brain PP (Repeated measures two- way ANOVA, followed by HSD post hoc test, n=8, ** P<0.01 and *** P<0.001, vehicle (Veh)+traumatic brain injury (TBI) and gallic acid (GA)+TBI vs. Veh+Sham, ### P<0.001, other groups vs Veh+TBI). Veh + Sham: sham operated received normal saline, Veh+TBI. TBI rats received normal saline, GA+TBI. TBI rats pretreated with 100 mg/kg GA. Base excitatory post synaptic potential (EPSP). EPSP recorded one hour before HFS, LTP 0.25-24. LTP recorded during different times after HFS.was increased significantly (P<0.001) at similar times in GA+TBI group when compared to Veh+TBI
