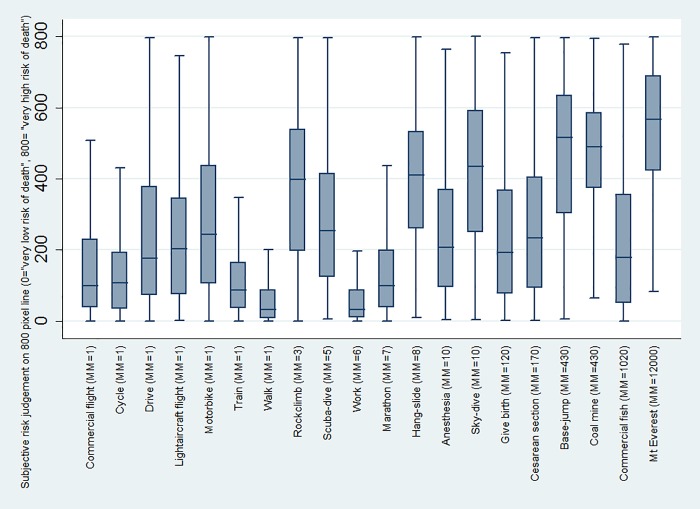
Fig 1. Box-plot of subjective risk perception on the 800-pixel line (i.e. responses varied between 0 and 800) for all 20 activities.
Each box represents the interquartile range of subjective risk perception judgements for each activity, with the median crossing within each box, and all data points within 1.5 of the upper and lower interquartile ranges are represented by the whiskers. MM = MicroMort value.

