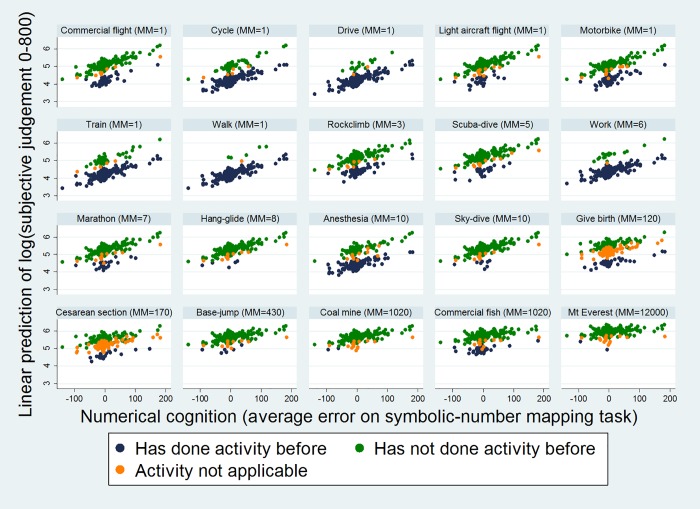
Fig 2. Scatter plots of linear predicted values (from fixed portion of mixed effects model; of log of 1 + judgment on 800 pixel line) relative to activities varying in their objective MicroMort (MM) risk, numerical ability (average error on symbolic-number mapping task) and prior experience.
Higher values on the y axis represent a higher perceived risk. It can be seen that those who underestimate on the symbolic-number mapping task, perceive risks to be lower, especially for low risk (smaller MicroMorts) activities; and further, those who have undertaken the task previously, perceive risks to be smaller.

