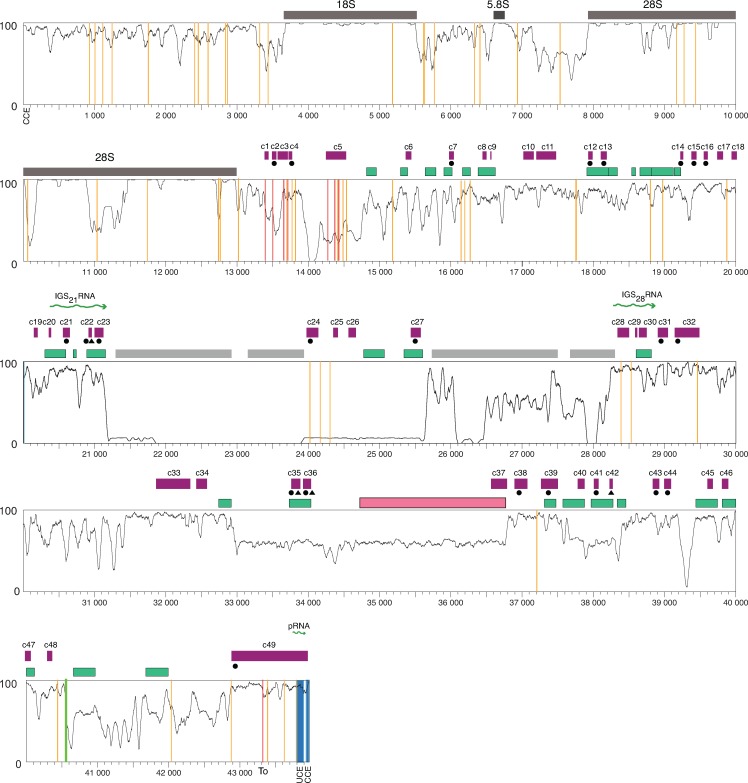
Fig 3. Sequence similarity plot of the primate rDNA.
The horizontal axis represents the position in the human rDNA; the vertical axis the level of sequence similarity between 0 (no identity) and 1 (all bases the same). A 50 bp sliding window with 1 bp increment was used to generate the similarity plot. Conserved regions in the IGS (purple boxes) were identified using phastCons. The positions of Alu elements (green boxes), microsatellites (grey boxes), a cdc27 pseudogene (pink box), the rRNA promoter (blue lines), previously identified IGS noncoding transcripts (green wiggly lines), c-Myc binding sites (orange lines), p53 binding site (green line), and Sal boxes (terminator elements; red lines) are indicated. Conserved regions with a black circle or triangle below are conserved in common marmoset and mouse rDNA, respectively.

