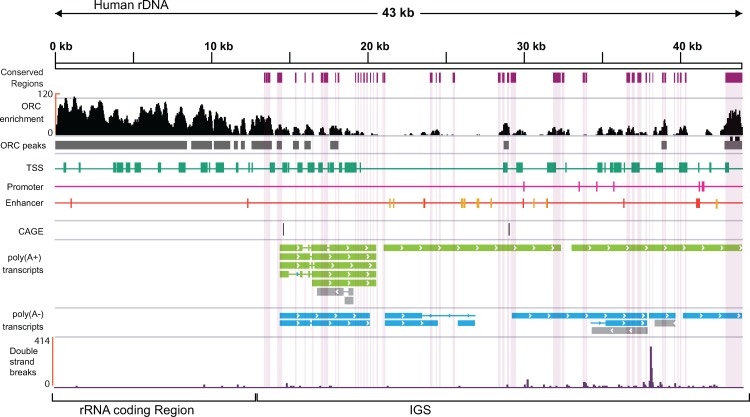
Fig 5. Origin replication complex (ORC) and double strand break (DSB) occurrence in the rDNA.
The black plot represents enrichment of ORC in Hela-S3 cells and grey boxes below represent the position of peaks. Scale on the left is the -fold enrichment, and the scale above shows the position in the rDNA. Purple boxes represent conserved regions. The predicted chromatin states: transcription start site (TSS; green boxes), promoter (pink boxes), and enhancer (orange boxes) are shown. CAGE peaks are shown as black boxes (positive strand). Long poly(A+) and poly(A-) transcripts with FPKM values > 1 are shown as green and blue boxes, respectively. Gray arrows show transcripts with FPKM < 1. Arrows indicate the direction of transcription. The purple plot at bottom represents the DSB sites in HEK293T cells.

