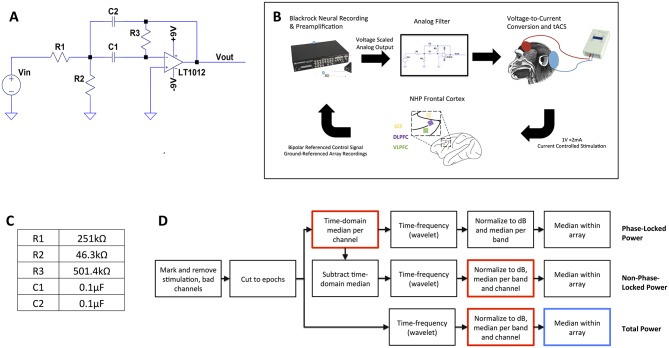
Fig 1. In vivo experiment design.
(A), circuit diagram of bandpass filter for oscillation-related feedback. The op-amp’s output could be coupled back to its input for direct voltage feedback, or to an external stimulator for isolated and/or optical stimulation. Vin and Vout are the input (LFP) and output (stimulation control) of the feedback system, respectively. (B), block diagram of in vivo testing. Signals were pre-amplified through a Blackrock Cerebus neural recording system, then fed through the analog filter and back to the brain through a voltage-controlled constant-current transcranial stimulation system. The inset shows the position of the supplemental eye field (SEF), dorsolateral prefrontal cortex (dlPFC), and ventrolateral prefrontal cortex (vlPFC) microelectrode recording arrays relative to major sulci. The macaque diagram shows the approximate location of tACS electrodes, with a smaller stimulating electrode placed on the scalp over the recording implants and a larger return electrode on the back of the head. In this paper, the SEF array was Array 1 and the dlPFC array was Array 2. (C), resistor and capacitor values used to realize the circuit for in vivo testing. (D), flow chart of analysis. After removal of stimulation artifact periods and bad channels, data passed through three separate streams to extract the total, phase-locked, and non-phase-locked power within the alpha, beta, and high-gamma frequency bands. Two sets of bootstrap/permutation testing were performed. The first tests for differences between conditions (Open, Brain, Closed) and whether each condition differs from zero effect. Red boxes within the flowchart highlight the permutation point, where labels are randomly shuffled. The second, performed only on the total power, tests for differences between Array 1 and Array 2.

