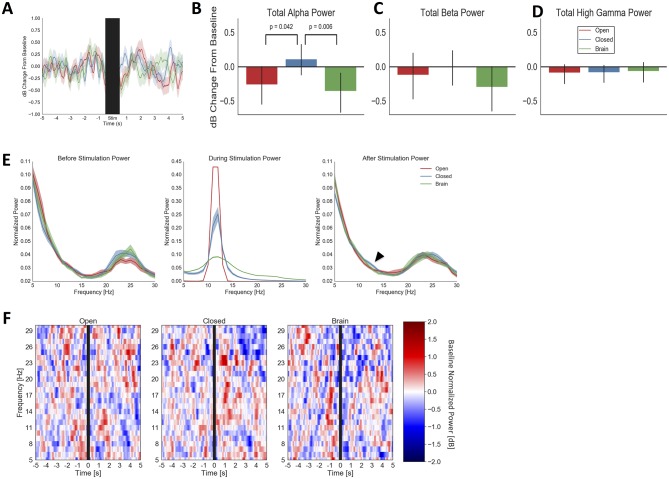
Fig 3. Physiologic response to analog feedback (Closed) and open-loop stimulation (Open, Brain) on Array 1.
(A), average pre/post stimulation traces with confidence bounds (1 standard deviation) computed by bootstrap resampling. The stimulation period (10 seconds ± 0.5 seconds to mask residual stimulation artifact) is indicated by a black bar. During the period immediately after stimulation offset, Closed-loop stimulation slightly increased alpha power over baseline, while open-loop controls decreased alpha power. (B), mean alpha power from 0.5 to 1 second after stimulation offset, further demonstrating Closed-loop alpha enhancement and Open-loop/Brain-based suppression. Closed differs from Open (p = 0.042 uncorrected; p = 0.126 FDR) and Brain (p = 0.006 uncorrected; p = 0.017 FDR) conditions on permutation testing, but not from its baseline in this analysis (p = 0.379 uncorrected, p = 0.491 FDR corrected). Error bars represent full 95% confidence interval from bootstrap resampling. (C), mean beta-band power during same period as (B). No condition has a significant change from its baseline or from another condition (all p > 0.07 uncorrected), suggesting that alpha-frequency stimulation preferentially affected alpha-band activity. (D), mean high-gamma-band power during same period as (B). No condition significantly differs from its baseline (all p > 0.210 uncorrected, 0.350 FDR corrected) or from another condition (all p > 0.571 both uncorrected and FDR corrected), suggesting that alpha-frequency stimulation did not directly affect spiking on Array 1. (E), normalized spectral densities of LFP from 1 to 0.5 seconds before stimulation (Before), the stimulation period (During), and 0.5 to 1 second after stimulation (After), for all three tested conditions. The conditions do not differ in alpha power before stimulation, but the subtle alpha enhancement from the Closed condition (the effect plotted in panel B) is visible in the rightmost panel. We have further highlighted this with an arrowhead. The blur about each line represents standard error of the mean for spectral estimate at each frequency, as calculated from 5,000 bootstrap samples with replacement. (F), time-frequency representations of Array 1 power, with the same data and time windows as in panel A. For clarity, only beta and below are shown. The changes plotted in the previous panels are not narrow-band but instead appear to occur throughout the alpha band.

