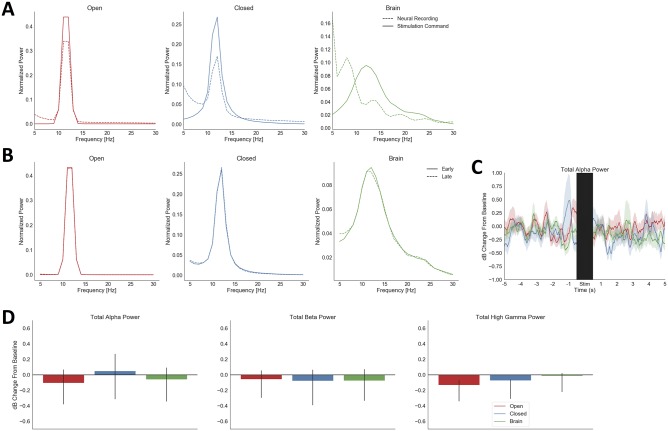
Fig 4. Verifications of correct system operation in vivo and in vitro.
(A), normalized spectra of neural recordings from the bipolar-referenced channel pair used for stimulator control, during the stimulation period, in all three tested conditions. These are plotted as dashed lines; the command voltage to the neurostimulator (the output of the filtering/feedback circuit) is overlaid as a solid line. In all three conditions, the neural recording contains substantial frequency content outside the filter passband and does not precisely match the command spectrum within the passband, evidence that the recorded signal was not simply a copy of the stimulator artifact. (B), mean normalized spectra of neural recordings across the entire Array 1, excluding the controlling pair, in all three tested conditions, for the first and the last 5 s of stimulation. Spectra are not appreciably different between the two halves of stimulation, suggesting a lack of wash-in effects. (C), average pre/post stimulation traces from in vitro saline testing, with plotting conventions as in Fig 3. The stimulation and amplifier settling period is again indicated by a black bar. Unlike the in vivo results, confidence intervals of all traces overlap after the stimulation period. (D), mean alpha, beta, and high gamma power from 0.5 to 1 second after stimulation offset in the in vitro saline test, with plotting conventions as in Fig 3. No condition differs from its pre-stimulation baseline (all p > 0.162 uncorrected, 0.485 FDR) or from another condition (all p > 0.109 uncorrected, 0.328 FDR). Although the confidence interval for Open-loop stimulation does exclude zero in the high gamma analysis, it does not do so sufficiently to reach the pre-determined significance threshold.

