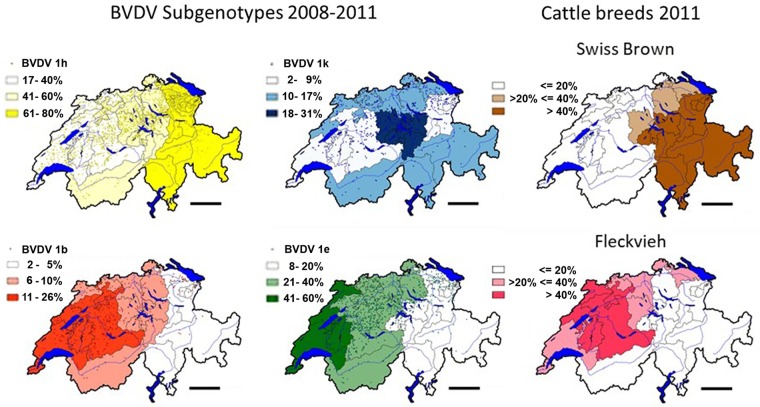
Fig 2. Distribution of the main subgenotypes of BVDV-1 and of Swiss Brown and Fleckvieh cattle.
The minimal and maximal proportions (in %) per canton between each of the four main subgenotypes BVDV-1b, -1k, -1e, and -1h was divided in three equal fractions and color-coded with the lowest third drawn in white, the middle third being light-colored and the highest third drawn in dark color. The percentage of the fractions per subgenotype are indicated in Fig 2. The dots represent the location of individual PI animals. The distribution per canton of the Fleckvieh and Swiss Brown cattle breeds are shown, with less than 20%, between 20% and 40%, and more than 40% indicated in white, light-brown and light-red, and dark brown and dark red, respectively. Data of cattle were taken from the national animal movement data base, populations as of 31st December, 2011 [41]. For details of the borders of individual cantons, see S1 Fig. The maps were calculated and drawn with the quantum GIS version 1.80-Lisboa software [47]. Bar = 50km.

